Critical Power Test?

Martín Jiménez Hernández
Thanks in advanced.

Karl-Axel Zander
The idea behind the "long effort" is to estimate FTP/AT/MLSS or what you want to call "the threshold" - the power at which the lactate production rate equals lactate combustion rate. 20min has (unfortunately) become standard for this test due to athletes find it more manageable, but at least a bit longer towards the hour is better parctice.
For the purpose of calculating "CP" (the point where the fitted CP-curve "flattens" out mathematically determined), just picking a duration for the "short effort" between 3-5 minutes is fine, as a second data point to form the CP-curve. Just make sure it's a real motivated all out effort against the duration. Talking from my own (narrow) experience, CP-tests between like 2-8 minutes I really recommend be in a dedicated session, as the fatigue & discomfort experienced after that feels substained even after a half an hour rest when lactate levels is back to baseline with good marginal
And yes - keeping up a good CP-testing routine is indeed considered a pain in the ass in practice by many athletes, but it's yields information of at least fair value (after some basic metabolic knowledge is applied) and require no additional lab equipment (assuming by now in 2017 that power meters is standard for even recreational athletes).
Sorry, spaced out when attempting consistently answer your first question, but thought you would find this useful

Guido Arrotino
Karl-Axel Zander
GC's CP Estimator uses a two-test protocol - would be interesting to see a similar study like in the paper comparing accuracy in 2 vs 3-test protocols

Ale Martinez
Assuming you're referring to the single-test protocol (3min max) of calculating CP mentioned in the paper - yes that looks like a terrible method of estimating CP (and thus getting the idea of the athlete's FTP/AT/MLSS which correlates high with performance in endurance sports). Test-wise "lazy" athletes that uses that will hopefully quickly notice that CP often get overestimated when looking at the data from following traning & racing.
GC's CP Estimator uses a two-test protocol - would be interesting to see a similar study like in the paper comparing accuracy in 2 vs 3-test protocols
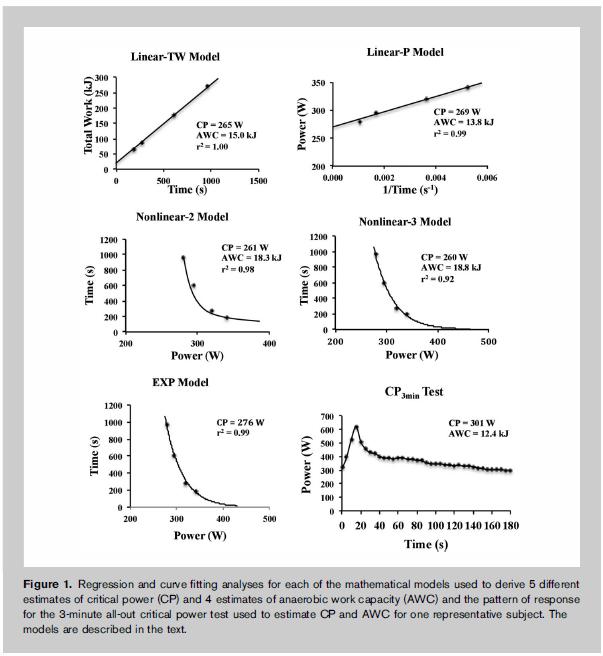
Differences among estimates of critical power and anaerobic work capacity derived from five mathematical models and the three-minute all-out test.
Abstract
Estimates of critical power (CP) and anaerobic work capacity (AWC) from the power output vs. time relationship have been derived from various mathematical models. The purpose of this study was to examine estimates of CP and AWC from the multiple work bout, 2- and 3-parameter models, and those from the 3-minute all-out CP (CP3min) test. Nine college-aged subjects performed a maximal incremental test to determine the peak oxygen consumption rate and the gas exchange threshold. On separate days, each subject completed 4 randomly ordered constant power output rides to exhaustion to estimate CP and AWC from 5 regression models (2 linear, 2 nonlinear, and 1 exponential). During the final visit, CP and AWC were estimated from the CP3min test. The nonlinear 3-parameter (Nonlinear-3) model produced the lowest estimate of CP. The exponential (EXP) model and the CP3min test were not statistically different and produced the highest estimates of CP. Critical power estimated from the Nonlinear-3 model was 14% less than those from the EXP model and the CP3min test and 4-6% less than those from the linear models. Furthermore, the Nonlinear-3 and nonlinear 2-parameter (Nonlinear-2) models produced significantly greater estimates of AWC than did the linear models and CP3min. The current findings suggested that the Nonlinear-3 model may provide estimates of CP and AWC that more accurately reflect the asymptote of the power output vs. time relationship, the demarcation of the heavy and severe exercise intensity domains, and anaerobic capabilities than will the linear models and CP3min test.
Karl-Axel Zander

Manuel Oberti
Ale Martinez
Ale,is possible to add this 6 charts on GC utilizing R ?
HOW ?
Manuel Oberti

Mark Liversedge
Martín Jiménez Hernández
b) 3 × 1 min of fast pedaling (with 1 min of recovery between intervals)
c) 3 mins recovery
d) 5 mins at 100% FTP.
f) 3 mins all out (starting on pedals, mantaining cadence between 85-95 rpm)
And then, once I get the CP using GC, can I simply use the CP value instead of FTP for my training plan? Assuming that the workouts may get more difficult??

Nathan Townsend

Ron George
Ale Martinez
2) There models in implemented in GC but how does the user have an idea which "fits" best? There is a parameter called 'RANK' in the model box on the CP chart however almost 95% of the time, it says 'N/A' for my activities. So this hasn't been useful. Any way I can correct this? Also, please define what 'rank' means, as I've been equating it to the quality of fit. For example, for all my runs with power data, the Ward-Smith model yields rank 5, extended CP is rank 3 and multicomponent is rank 4. How do you interpret this scale?
