Advanced Interval Analysis
1,860 views
Skip to first unread message

Mark Liversedge
Apr 21, 2015, 11:10:44 AM4/21/15
to golden-che...@googlegroups.com
Hi,
We are unlikely to bring interval analysis into 3.2. There is a codebase in there that Damien wrote but it is not active. I think it would be good to start thinking and discussing it. Especially since Damien has already had another look at the code.
Functionally, it really breaks down into 3 things;
1. Extracting intervals from rides
This will mean automatically identifying parts of a ride as intervals. The key here will be what rules or types of intervals are extracted. At present we could have;
- Route - user labelled routes or segments that represent a route you ride often. it may be a particular climb or col you regularly ride, or perhaps a 10mile TT or training loop. Its identified using GPS.
- Climb - extracting intervals where you climbed/descended; we will need to identify short-steep ramps as long as longer shallower grades. Some kind of scoring metric might be useful for classifying these. Likely to overlap with a Route but do not need GPS, they are extracted based upon distance and altitude.
- Peak - peak durations; for power but also cadence, hr, speed/pace.
- Efforts - a sustained effort. This is quite tricky to describe but basically represents a power interval. Using the zone and CP config we will identify efforts that represent an Anaerobic, Aerobic, VO2Max, Threshold effort. These are likely to overlap with Peak power intervals.
- Matches - A particular kind of sustained effort where W' is being consumed, so will span all zones above CP.
These intervals will be identified and associated with the ride in which they occur but will not be added to the ridefile. Which therefore leaves us with one last interval type:
- User - user defined intervals; the ones you added to the ride using the find intervals tools. Likely to also overlap with the automatic ones
Since there is an overlap with these intervals we will need to think about how we remove duplicates in the UI to ensure you don't see lots of intervals all the same.
2. Augment the Intervals for an activity
Pretty obvious, but once we have extracted all these intervals automatically we should asociate them with the rides so you can plot and select them in the activity view.
This will basically mean that the interval sidebar in activity view will list all 6 types of intervals to allow you to select them or drag and drop them into the compare pane.
If we do this then no other coding is needed to allow you to plot an interval sample by sample -or- compare intervals sample by sample.
3. Interval View
Select and chart 'sets' of intervals. To be able to track and compare intervals.
Like the trends view it is about selecting and charting; where the trends view is focused on sets of rides over time, the interval view is about sets of intervals over time. Of course there is a big difference here, we are looking at specific sections of rides that are interesting for a particular reason.
This particular reason means we are going to be looking for indicators and correlations that go a lot further than just quantifying stress or tracking improvements (or lack of them). These particular reasons are likely to warrant us to offer different types of charts and features within the charts, some that immediately come to mind are:
- Ranking and Ordering - Showing intervals in some form of ordered / ranked chart. Possibly just a bar chart or histogram.
- Scatter / Bubble - Plotting intervals spatially to show any correlations or patterns e.g. gradient and peak power (from discussion on the list). There are possibly other new metrics we will want to add for analysing intervals but we have some useful ones now like fatigue and pacing index.
- Radar Plot - this is actually likely to be equally useful for rides; but aggregating/averaging multiple dimensions for a set.
- Compare - Sets of intervals with each other; showing each set in a different color
- Query/Filter Sets - The sidebar will need to be designed to select intervals into a set; almost certainly using the same approach data filters and autofiltering ux we use in the trends view, but adjusted for intervals. For example; where in trends we allow the user to autofilter by a metadata field, we might autofilter by interval type (e.g. an autofilter for all 5s peaks, all routes called 'Fave Loop').
There is probably more we could add to this, but this is enough to start thinking about it and discussing ideas.
Mark

Luther Gulseth
Apr 21, 2015, 1:57:04 PM4/21/15
to golden-cheetah-users
How hard would it be to add a "Create Interval" button to the Intervals window in maps? This would make Lap x a saved interval defined by GPS. This could allow you to tap your Lap button at the beginning and end of an interval you always want to use and later easily save it.
Also, would laps from within rides be automatically added to the database? I generally have auto lap on for 1mi segments, unless I'm racing, then it's auto lap by GPS position. I would want the position laps, but not all of the 1mi segments, as many of those have a mix of efforts.
On Tue, Apr 21, 2015 at 10:10 AM, Mark Liversedge <liver...@gmail.com> wrote:
User - user defined intervals; the ones you added to the ride using the find intervals tools. Likely to also overlap with the automatic ones
Luther

Pete from AUS
Apr 21, 2015, 8:58:43 PM4/21/15
to golden-che...@googlegroups.com
Within Interval View we would want a MMP-style plot that includes 2nd, 3rd, 4th...best efforts?
This has been asked/discussed before but I don't think ever reached a conclusion.
Pete

Ben Wooliscroft
Apr 21, 2015, 9:41:15 PM4/21/15
to golden-che...@googlegroups.com
One interesting option might be to have a line with a thickness that covers bests 1-x. A very thin line would show consistency and a wide one might highlight a lack of testing or a rogue “best”. But, you’ve probably thought of this already?
Cheers
Ben
--
_______________________________________________
Golden-Cheetah-Users mailing list
golden-che...@googlegroups.com
http://groups.google.com/group/golden-cheetah-users?hl=en
---
You received this message because you are subscribed to the Google Groups "golden-cheetah-users" group.
To unsubscribe from this group and stop receiving emails from it, send an email to golden-cheetah-u...@googlegroups.com.
For more options, visit https://groups.google.com/d/optout.
Pete from AUS
Apr 21, 2015, 10:13:18 PM4/21/15
to golden-che...@googlegroups.com
Ben -
We sort of have that with with 'heat map' option on the current MMP.
What wee don't get yet however is multiple bests from within one ride.
Pete
To unsubscribe from this group and stop receiving emails from it, send an email to golden-cheetah-users+unsub...@googlegroups.com.
Mark Liversedge
Apr 22, 2015, 4:11:37 AM4/22/15
to golden-che...@googlegroups.com
On Wednesday, 22 April 2015 01:58:43 UTC+1, Pete from AUS wrote:
Within Interval View we would want a MMP-style plot that includes 2nd, 3rd, 4th...best efforts?This has been asked/discussed before but I don't think ever reached a conclusion.
Interesting, remember we are looking at sets of intervals across rides (although one option would be to filter for a specific ride).
We would be able to show all the sustained efforts but not just bests for every duration. Otherwise we would have to extract hundreds of thousands of intervals with top n for every duration. If for example you did a 5x5 workout I would expect each of the 5min intervals to be detected as sustained efforts (assuming you didn't dolly one of them).
The CP chart has a quantile plot that might already give you what you need (they are extracted for the plot) ?

Or have I misunderstood?
Mark
Pete from AUS
Apr 24, 2015, 7:26:19 AM4/24/15
to golden-che...@googlegroups.com
Just to take a step back for a moment...
For rides with specific intervals like 5x5 would you really want to see those across multiple rides?
5 mins @ x watts is going to look pretty much the same each time you do it.
As opposed to maximal efforts, races, hammerfest, hill climbs, etc where there might be PB's and other "unexpected" outcomes.
I'm not making any particular point, but might just help sow the seeds of what we want here and why
Pete
Mark Liversedge
Apr 24, 2015, 8:21:24 AM4/24/15
to golden-che...@googlegroups.com
On Friday, 24 April 2015 12:26:19 UTC+1, Pete from AUS wrote:
Just to take a step back for a moment...
For rides with specific intervals like 5x5 would you really want to see those across multiple rides?
5 mins @ x watts is going to look pretty much the same each time you do it.
I think I would; has the maximal power improved and/or has my drop off from first to fifth improved.
Mark
Mark Liversedge
Apr 24, 2015, 4:41:12 PM4/24/15
to golden-che...@googlegroups.com
Quick update: Damien is working on the automatic discovery and augmenting the interval list (point 1 and 2 below).
We will put this into v3.2 and wait till v4.0 for the interval view (point 3 below).
Mark
On Tuesday, 21 April 2015 16:10:44 UTC+1, Mark Liversedge wrote:
1. Extracting intervals from rides
2. Augment the Intervals for an activity
3. Interval View

Mike Patton
Apr 30, 2015, 1:42:11 PM4/30/15
to golden-che...@googlegroups.com
One thing to keep in mind is the importance of the duration and intensity of the recovery period on the interpretation of the intervals. If the intervals are automatically discovered, perhaps you could have the software create intervals for the "in-between" periods to make it easier to look at that part, even just in normal ride view?
Mark Liversedge
Apr 30, 2015, 1:53:50 PM4/30/15
to golden-che...@googlegroups.com
On Thursday, 30 April 2015 18:42:11 UTC+1, Mike Patton wrote:
One thing to keep in mind is the importance of the duration and intensity of the recovery period on the interpretation of the intervals. If the intervals are automatically discovered, perhaps you could have the software create intervals for the "in-between" periods to make it easier to look at that part, even just in normal ride view?
I was thinking about that.
Essentially we want to know what 'state' we were in when the interval started, right? Not so much that they just had a 1m recovery interval but more accumulated/recovered capacity; W', Energy, Distance, Duration etc ? I wonder if there are some killer metrics that would apply ?
Or like you say, for every 'sustained' interval just have an associated 'preceeding' interval with all the associated metrics applying?
Mark
Mike Patton
Apr 30, 2015, 3:00:37 PM4/30/15
to golden-che...@googlegroups.com
I think a simple "preceding" interval would be great.
Being able to re-create a description like someone would use in a planning sense might be helpful in terms of automatic categorization of the ride for comparison purposes. For example, if the plan going in was "5x5 minutes @ 300W with 10 minutes recovery between at 150W" or "3 sets of 2x 30 seconds all-out with 5 minutes rest between intervals and 15 minutes rest between sets"...
If the interval was listed as %CP as well as absolute wattage that might make it easier to find relevant comparison workouts.
Pete from AUS
May 9, 2015, 8:07:00 AM5/9/15
to golden-che...@googlegroups.com
There might perhaps be a role for a 'compare' type view for intervals for some analysis compared to a 'bests' type view?
Mark Liversedge
May 16, 2015, 10:05:18 AM5/16/15
to golden-che...@googlegroups.com, mi...@podiumbound.com
The first set of updates for interval discovery is done, but there is a lot left to do.
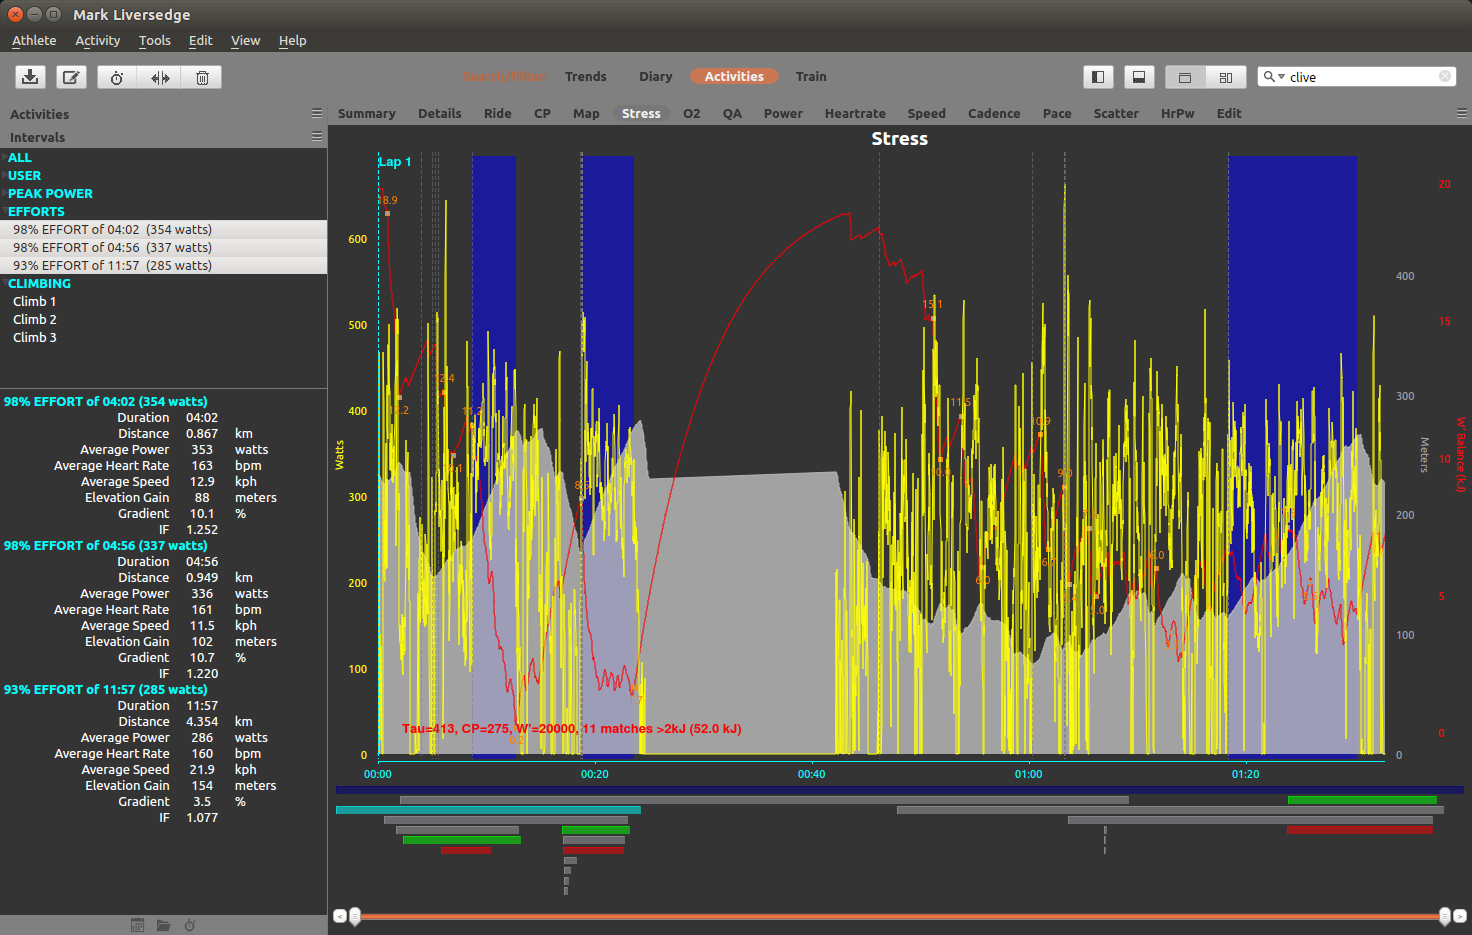
Damien and I have added automatic interval discovery for Peaks, Exhaustive Efforts, Sustained Efforts, Hills and Routes. Still need to think about best way of handling 'rest' / 'warmup' and 'recovery' intervals.
The basic interval functions now need reworking to fit in with this new paradigm, but the rest of the code seems pretty solid.
Here is an example, where my ride partner had a puncture mid-ride and ripped my legs off in revenge for a sarcastic comment :)
Cheers
Mark
Mark Liversedge
May 17, 2015, 8:33:59 AM5/17/15
to golden-che...@googlegroups.com, liver...@gmail.com, mi...@podiumbound.com
On Saturday, 16 May 2015 15:05:18 UTC+1, Mark Liversedge wrote:
The first set of updates for interval discovery is done, but there is a lot left to do.Damien and I have added automatic interval discovery for Peaks, Exhaustive Efforts, Sustained Efforts, Hills and Routes. Still need to think about best way of handling 'rest' / 'warmup' and 'recovery' intervals.
I've blogged on how sustained and exhaustive efforts work here: http://markliversedge.blogspot.co.uk/2015/05/finding-tte-and-sustained-efforts-in.html
Mark

Ruud Goorden
May 17, 2015, 4:16:14 PM5/17/15
to golden-che...@googlegroups.com
Good work!
Mark Liversedge
Jun 12, 2015, 6:49:52 AM6/12/15
to golden-che...@googlegroups.com, liver...@gmail.com
A video demo of interval analysis in GoldenCheetah, including analysing a Grand Tour TT ride: https://vimeo.com/130530369
Mark
Ruud Goorden
Jun 12, 2015, 9:57:03 AM6/12/15
to golden-che...@googlegroups.com
What's the link for this development build or is it not available yet?
Mark Liversedge
Jun 12, 2015, 10:01:36 AM6/12/15
to golden-che...@googlegroups.com, rmc_g...@hotmail.com
On Friday, 12 June 2015 14:57:03 UTC+1, Ruud Goorden wrote:
What's the link for this development build or is it not available yet?
I need to sort the last few upgrade nits this weekend then we will start on a RC schedule.
Mark
Ruud Goorden
Jun 12, 2015, 10:43:57 AM6/12/15
to golden-che...@googlegroups.com
Ok tnx. Looks good and insightful though!

mshalett
Jun 12, 2015, 3:03:18 PM6/12/15
to golden-che...@googlegroups.com
Way cool! Great work and fantastic instructional video! Thanks Mark and the rest of the coders for your contributions! Looking forward to it.
Monte
Luther Gulseth
Jun 12, 2015, 11:43:48 PM6/12/15
to Mark Liversedge, golden-che...@googlegroups.com
LOVE the video. Thanks for the info!
On this note, the 2015-02-13 Devel Build doesn't have the "Create a route segment" option in the Intervals right-click menu. Does someone have a more recent pull compiled for Win 64 that I could use? Thanks!
Luther
On this note, the 2015-02-13 Devel Build doesn't have the "Create a route segment" option in the Intervals right-click menu. Does someone have a more recent pull compiled for Win 64 that I could use? Thanks!
Luther
On 6/12/2015 5:49 AM, Mark Liversedge
wrote:
A video demo of interval analysis in GoldenCheetah, including analysing a Grand Tour TT ride: https://vimeo.com/130530369
Mark
--
_______________________________________________
Golden-Cheetah-Users mailing list
golden-che...@googlegroups.com
http://groups.google.com/group/golden-cheetah-users?hl=en
---
You received this message because you are subscribed to the Google Groups "golden-cheetah-users" group.
To unsubscribe from this group and stop receiving emails from it, send an email to golden-cheetah-u...@googlegroups.com.
For more options, visit https://groups.google.com/d/optout.

Reply all
Reply to author
Forward
0 new messages