Compiler performance with a huge project

Dave Cheney


Aram Hăvărneanu
unmanageable.
I'm willing to help in bringing the compile performance back as much as I can.
--
Aram Hăvărneanu

Konstantin Shaposhnikov
It would be interesting to see size of the created binary on the same graph.
--
You received this message because you are subscribed to the Google Groups "golang-dev" group.
To unsubscribe from this group and stop receiving emails from it, send an email to golang-dev+...@googlegroups.com.
For more options, visit https://groups.google.com/d/optout.
Dave Cheney

Rob Pike
Dave Cheney
Is the graph labeled correctly?
On Mon, Mar 7, 2016 at 11:22 AM, Dave Cheney <da...@cheney.net> wrote:
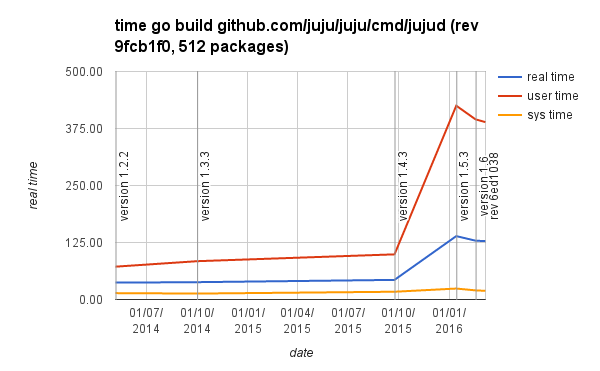
Hello,By a quirk of fate, the juju codebase has had to maintain compatibility with go 1.2 since that release. This afternoon I did an experiment compiling and linking our biggest command, 512 packages in total, with the latest release compiler from each minor revision.The raw results are here, along with a graph on the second tab. The test machine was a thinkpad x220, Intel(R) Core(TM) i5-2520M CPU @ 2.50GHz, 8gb of ram, everything running out of a ramdisk on /tmp.
<image.png>
https://docs.google.com/spreadsheets/d/1mczKWp3DUuQvIAwZiORD29j5LRb96QZC4mZDn72gAE4/edit?usp=sharingI have heard rumours that others are also collecting benchmark data, but they may not have access to such a pathological data set as juju :) I intend to keep this data set current for as long as I have access to this machine.ThanksDave

David Crawshaw
import Joe's SAIS package into the linker:
https://github.com/golang/go/issues/14648#issuecomment-192550869

Pierpaolo Bernardi
Pierpaolo Bernardi
Is the graph labeled correctly?
Dave Cheney
-rwxr-xr-x 1 dfc dfc 88174297 Mar 7 20:43 jujud
and comparing that to one just compiled with tip
-rwxrwxr-x 1 dfc dfc 79450868 Mar 7 12:44 /home/dfc/bin/jujud
Which looks like 10% reduction in binary size!
Rob Pike
Dave Cheney
It's just what is in tip at the time. The only revisions that I believe has the ssa checks enabled are the ones post 1.6.
I intend to keep the chart updated over time.
Rob Pike
Dave Cheney
The peek was go 1.5, things look to be getting better since then.

Brad Fitzpatrick
Rob Pike
Rob Pike
Dave Cheney
The line I'm tracking is real time, which grew by 2.5x after go 1.5.
I'll drop reporting the sys and user times on the graph, it is confusing.
Rob Pike

Ian Lance Taylor
> User time got almost 10X worse. I want to know why.
Ian
Rob Pike

hartwig...@gmail.com
Dave Cheney
If the SSA enabled compiler produces (smaller and) faster binaries, then I think the SSA enabled version from tip should be (re-)compiled by itself to see the best results...?
(In addition to disabling consistency checks)
Dave Cheney

andrewc...@gmail.com
Anyone other than Dave actively looking into a cause?
Rob Pike
SSA costs about 20% relative to the old compiler.
All those factors ignore whatever setup and linking overhead there might be and assume it's all in the compiler.
Dave Cheney
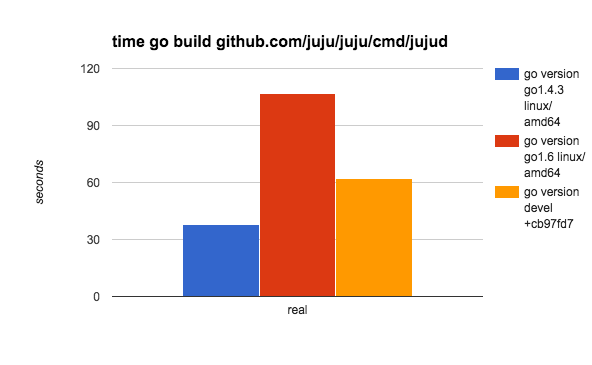
| version 1.4.3 | real | 00:00:43 | |
| user | 00:01:39 | ||
| sys | 00:00:17 | ||
| version 1.5.3 | real | 00:02:19 | |
| user | 00:07:05 | ||
| sys | 00:00:24 | ||
| version 1.6 | real | 00:02:09 | |
| user | 00:06:35 | ||
| sys | 00:00:20 | ||
| rev 6ed1038 | real | 00:02:11 | |
| user | 00:06:39 | ||
| sys | 00:00:19 |
Rob Pike
Dave Cheney

Devon H. O'Dell
Rob Pike
Dave Cheney
However I am misinterpreting the graph, there are numbers on it that are worse than I can reproduce in my own code base, which means juju is causing worse performance.
Rob Pike
Rob Pike
Konstantin Shaposhnikov
FYI turning off GC can actually decrease compilation times (especially user time):
$ go version
go version go1.6 linux/amd64
$ time go build -a std
real 0m6.569s
user 0m27.592s
sys 0m2.719s
$ time GOGC=off go build -a std
real 0m5.583s
user 0m12.872s
sys 0m3.597s
Rob Pike
Dave Cheney

David Chase
Rob Pike
Dave Cheney
girth of the dependency graph that goes into a single binary, which
makes it useful because it brings compile and link times into human
scales.
As an experiment I built a test set from another large open source
project and ran the same tests for a command with 304 dependent
packages.
1.4.3
real 0m29.428s
user 1m19.825s
sys 0m10.983s
real 0m31.618s
user 1m26.436s
sys 0m11.854s
real 0m31.474s
user 1m26.892s
sys 0m12.298s
tip (beabd872f43)
real 1m36.218s
user 5m21.163s
sys 0m12.090s
real 1m38.975s
user 5m31.432s
sys 0m12.091s
real 1m39.403s
user 5m33.396s
sys 0m12.276s
This shows the same 3x increase in real time, and a smaller 3.7x
increase, vs the 4.5x for benchjuju, in user time.
You can find the dataset here,
https://github.com/davecheney/benchkube. I have no preference which
data set to use, I think they are both good data sets for benchmarking
the compiler.
Thanks
Dave
andrewc...@gmail.com
1.6:
ac@black:~/src/benchjuju$ ./benchjuju.bash
go version go1.6 linux/amd64
real 1m0.099s
user 2m45.420s
sys 0m6.476s
GOGC=off
ac@black:~/src/benchjuju$ ./benchjuju.bash
go version go1.6 linux/amd64
real 0m38.019s
user 1m22.640s
sys 0m9.468s
tip:
ac@black:~/src/benchjuju$ ./benchjuju.bash
go version devel +beabd87 Tue Mar 8 06:02:15 2016 +0000 linux/amd64
real 1m2.182s
user 2m48.584s
sys 0m6.092s
GOGC=off
go version devel +beabd87 Tue Mar 8 06:02:15 2016 +0000 linux/amd64
real 0m43.500s
user 1m39.920s
sys 0m9.196s
Rob Pike
David Crawshaw
For the compiler, it turns out pprof can merge profiles, which means
that adding:
gcargs = append(gcargs, "-cpuprofile", ofile+".prof")
to func (gcToolchain) gc in cmd/go, then building juju with -work
gives you a set of profiles you can merge with:
go tool pprof -proto -output=/tmp/juju.prof
../pkg/tool/darwin_amd64/compile $(find $WORK -name \*.prof)
It looks something like the the attached SVG. Definitely GC-dominated,
but the graph gives up several interesting compiler functions.
David Chase

to...@tneal.org
It looks something like the the attached SVG. Definitely GC-dominated,
but the graph gives up several interesting compiler functions.

Egon Elbre


Egon Elbre
hacky CL for gantt diagram: https://gist.github.com/egonelbre/72b5a88cf5b65e8035f4

Russ Cox

Austin Clements
Konstantin Shaposhnikov

Josh Bleecher Snyder
> way. 40% of the time is spent in mcentral.grow, which does basically nothing
> except construct a free list in a span. I would think that time is coming
> from page faults demand allocating as the heap grows (mcentral.grow is the
> first hit on fresh pages), but that disagrees with the relatively low system
> time everyone has been reporting. Plus, unless the heap is significantly
> larger than it was in 1.4, I would expect the total page fault cost to be
> roughly the same. It's also possible this is a NUMA thing
> (https://golang.org/issue/14406), but again I would expect high system time
> in that case.
>
> If this is in fact just the cost of initializing the free lists, Rick's work
> on dev.garbage should completely eliminate that hot spot. (+Rick)
(https://groups.google.com/forum/#!topic/golang-dev/ORLpF3EFNAk), I
did the experiment that Keith suggested in that thread and found that
the actual freelist construction is about 5% of CPU, not 40-50%.
However, it also isn't just the cost of allocation and page faults.
Near the end of the 1.5 cycle, Russ dramatically shrunk gc.Node and
thus total allocation, but the compiler didn't get much faster. To
confirm this (the other direction), I just tried adding a `waste
[1024]byte` field to the beginning of gc.Node. See below for raw
output. Max rss went up 3.84x, but real time only went up 1.3x. The
compilebench numbers tell an every stranger story--allocation size up
~60%, but compile times up only ~10%.
Something doesn't line up here--or at least, I don't get it. It's not
freelist construction, but it's also not just the allocation/page
faults. So...where is that time going?
-josh
BEFORE
$ /usr/bin/time -l go build -a cmd/compile
21.16 real 42.91 user 2.13 sys
293007360 maximum resident set size
0 average shared memory size
0 average unshared data size
0 average unshared stack size
562976 page reclaims
0 page faults
0 swaps
0 block input operations
38 block output operations
0 messages sent
0 messages received
92 signals received
24379 voluntary context switches
21262 involuntary context switches
$ compilebench -alloc
BenchmarkTemplate 1 497372696 ns/op 90749704 B/op 1192427 allocs/op
BenchmarkGoTypes 1 1654796540 ns/op 321811744 B/op 3677910 allocs/op
BenchmarkCompiler 1 6103388695 ns/op 1137140632 B/op 14453247 allocs/op
AFTER
$ /usr/bin/time -l go build -a cmd/compile
27.65 real 44.58 user 4.02 sys
1126416384 maximum resident set size
0 average shared memory size
0 average unshared data size
0 average unshared stack size
1477640 page reclaims
0 page faults
0 swaps
0 block input operations
62 block output operations
0 messages sent
0 messages received
92 signals received
36955 voluntary context switches
23861 involuntary context switches
$ compilebench -alloc
BenchmarkTemplate 1 556708260 ns/op 171546368 B/op 1194963 allocs/op
BenchmarkGoTypes 1 1770277297 ns/op 529007048 B/op 3685483 allocs/op
BenchmarkCompiler 1 6631047305 ns/op 1847756392 B/op 14478548 allocs/op
Dave Cheney
--
Russ Cox
Thanks Egon,On my list today was to modify my local cmd/go to output build times per package so I could sort them. I'll report back when I have done that.
Russ
Dave Cheney
go build -toolexec="/usr/bin/time -f '%e %U %S %C'"
github.com/juju/juju/cmd/jujud
with some post processing looks promising, I'll report back with the results.
Dave Cheney
^ tip (0c7ccbf6) fresh this morning
go1.4 does not support -toolexec, so I'll bodge something in and do
the same test there.
andrewc...@gmail.com
There is 1 million lines of non test code taking 1 minute of real time, and these packages are 100k total. Combined they take 20 seconds, or 1/3 of the build time for 1/10 the code. It would be great to see some profiles of those two packages if someone has time.
Dave Cheney
a profile directly, Have a look at that if you have time.
Konstantin Shaposhnikov
> There is 1 million lines of non test code taking 1 minute of real time, and these packages are 100k total. Combined they take 20 seconds, or 1/3 of the build time for 1/10 the code. It would be great to see some profiles of those two packages if someone has time.
Not sure if you have seen it but I've sent some profiling results of compiling types package earlier to this thread.
>
> On Wednesday, March 9, 2016 at 10:21:40 AM UTC+13, Dave Cheney wrote:
>>
>> https://gist.github.com/davecheney/401ee7514927887683cb
>>
>> ^ tip (0c7ccbf6) fresh this morning
>>
>> go1.4 does not support -toolexec, so I'll bodge something in and do
>> the same test there.
>>
>> On Wed, Mar 9, 2016 at 7:42 AM, Dave Cheney <da...@cheney.net> wrote:
>> > /me slaps forehead
>> >
>> > go build -toolexec="/usr/bin/time -f '%e %U %S %C'"
>> > github.com/juju/juju/cmd/jujud
>> >
>> > with some post processing looks promising, I'll report back with the results.
>> >
>> > On Wed, Mar 9, 2016 at 7:34 AM, Russ Cox <r...@golang.org> wrote:
>> >> On Tue, Mar 8, 2016 at 3:27 PM, Dave Cheney <da...@cheney.net> wrote:
>> >>>
>> >>> Thanks Egon,
>> >>> On my list today was to modify my local cmd/go to output build times per
>> >>> package so I could sort them. I'll report back when I have done that.
>> >>
>> >>
>> >> go build -toolexec time, right? :-)
>> >>
>> >> Russ
>
Dave Cheney
The vim25/types package is odd, it contains 5200+ func init()'s, which is part of the autogenerated nature of the code (I'm thinking back to what bwk said about generated code being the meanest to compile).
Dave Cheney
strange form of the vim25/types package; many types, each with its own
init function.
https://godoc.org/github.com/davecheney/genpkg
The results are pretty comparable, n=5000 creates a package that compiles thusly
lucky(~/src/genpkg) % time go1.4 build ./x
real 0m2.165s
user 0m1.986s
sys 0m0.180s
lucky(~/src/genpkg) % time go build ./x
real 0m6.724s
user 0m9.556s
sys 0m0.161s
Thinking that it was the thousands of init functions, I added a
-noinitfn flag to the generator to have it emit one giant map
initialiser and the results were the compiler blew out to 4gb before I
killed it. Running with a smaller value revealed this
lucky(~/src/genpkg) % go run gen.go -n 1000 > x/types.go
lucky(~/src/genpkg) % time go1.4 build ./x
real 0m0.316s
user 0m0.273s
sys 0m0.044s
lucky(~/src/genpkg) % time go build ./x
real 0m1.456s
user 0m1.816s
sys 0m0.122s
lucky(~/src/genpkg) % go run gen.go -n 1000 -noinitfn > x/types.go
lucky(~/src/genpkg) % time go1.4 build ./x
real 0m0.618s
user 0m0.575s
sys 0m0.047s
lucky(~/src/genpkg) % time go build ./x
real 0m8.491s
user 0m10.595s
sys 0m0.338s
Good hunting!
Thanks
Dave

Bjørn Erik Pedersen
| linux/amd64 | darwin/amd64 | |
| 1.4.3 | 1.162 | 2.111 |
| 1.5.3 | 2.417 | 3.846 |
| 1.6 | 2.521 | 3.758 |
| aa3650f | 1.711 | 2.346 |
All real times.
https://travis-ci.org/spf13/hugo/builds/114741729
Not sure about the spec of the hardware, but happy to see the result of the latest Go.
bep
mandag 7. mars 2016 11.22.36 UTC+1 skrev Dave Cheney følgende:
Hello,By a quirk of fate, the juju codebase has had to maintain compatibility with go 1.2 since that release. This afternoon I did an experiment compiling and linking our biggest command, 512 packages in total, with the latest release compiler from each minor revision.The raw results are here, along with a graph on the second tab. The test machine was a thinkpad x220, Intel(R) Core(TM) i5-2520M CPU @ 2.50GHz, 8gb of ram, everything running out of a ramdisk on /tmp.
https://docs.google.com/spreadsheets/d/1mczKWp3DUuQvIAwZiORD29j5LRb96QZC4mZDn72gAE4/edit?usp=sharingI have heard rumours that others are also collecting benchmark data, but they may not have access to such a pathological data set as juju :) I intend to keep this data set current for as long as I have access to this machine.ThanksDave
Dave Cheney
Bjørn Erik Pedersen
bep
David Chase
time go build -gcflags='-d=ssa/check/off -memprofile=x.mprof' ./x
go tool pprof -alloc_space /Users/drchase/GoogleDrive/work/go-ssa/pkg/tool/darwin_amd64/compile x/x.mprof

Damian Gryski
On Wednesday, March 9, 2016 at 6:21:46 PM UTC+1, David Chase wrote:
Playing with genpkg on tip:go run gen.go -n 3000 -noinitfn > x/types.go
time go build -gcflags='-d=ssa/check/off -memprofile=x.mprof' ./x
go tool pprof -alloc_space /Users/drchase/GoogleDrive/work/go-ssa/pkg/tool/darwin_amd64/compile x/x.mprofSo it happens that check is a pig and I haven't looked into that yet, but...
<snipped>
i.e., (sorry for the crap formatting) it's reference linking in ssa.go, and regalloc, by a lot.newValue is almost 100% linkForwardReferences -> resolveFwdRef -> lookupVarOutgoing -> (*Block)NewValue0A -> (*Func)NewValuelookupVarOutgoing (flat cost) is all at m[name] = v (i.e., forward references).buildInterferenceGraph is just the interference graph.I think that's good for a start.
David Chase
--
Dave Cheney
The compilation times for state are in excess of 14 seconds on this machine, however I noticed that if I reduce the -p setting from the default of 4 (for this machine) to 2, the timings for state drop signficantly, yet the overall times for the whole build are comparable (they are not exact, but given we're halving the effective concurrency, I feel they are close enough to say they are similar)
lucky(~/devel/benchjuju) % grep ^real /tmp/benchjuju.bb48b86-p*.txt
/tmp/benchjuju.bb48b86-p2.txt:real 1m56.889s
/tmp/benchjuju.bb48b86-p2.txt:real 2m7.545s
/tmp/benchjuju.bb48b86-p2.txt:real 2m12.262s
/tmp/benchjuju.bb48b86-p2.txt:real 2m13.698s
/tmp/benchjuju.bb48b86-p2.txt:real 2m14.841s
/tmp/benchjuju.bb48b86-p4.txt:real 1m50.869s
/tmp/benchjuju.bb48b86-p4.txt:real 1m58.680s
/tmp/benchjuju.bb48b86-p4.txt:real 2m0.544s
/tmp/benchjuju.bb48b86-p4.txt:real 2m1.168s
/tmp/benchjuju.bb48b86-p4.txt:real 2m2.037s
lucky(~/devel/benchjuju) % grep juju/state.a\ /tmp/benchjuju.bb48b86-p*.txt | cut -f -6 -d ' '
/tmp/benchjuju.bb48b86-p2.txt:7.77 9.82 0.15 /home/dfc/go/pkg/tool/linux_amd64/compile -o $WORK/github.com/juju/juju/state.a
/tmp/benchjuju.bb48b86-p2.txt:8.61 10.78 0.24 /home/dfc/go/pkg/tool/linux_amd64/compile -o $WORK/github.com/juju/juju/state.a
/tmp/benchjuju.bb48b86-p2.txt:9.20 11.58 0.19 /home/dfc/go/pkg/tool/linux_amd64/compile -o $WORK/github.com/juju/juju/state.a
/tmp/benchjuju.bb48b86-p2.txt:9.08 11.37 0.20 /home/dfc/go/pkg/tool/linux_amd64/compile -o $WORK/github.com/juju/juju/state.a
/tmp/benchjuju.bb48b86-p2.txt:9.36 11.82 0.21 /home/dfc/go/pkg/tool/linux_amd64/compile -o $WORK/github.com/juju/juju/state.a
/tmp/benchjuju.bb48b86-p4.txt:11.74 12.20 0.24 /home/dfc/go/pkg/tool/linux_amd64/compile -o $WORK/github.com/juju/juju/state.a
/tmp/benchjuju.bb48b86-p4.txt:14.10 14.56 0.26 /home/dfc/go/pkg/tool/linux_amd64/compile -o $WORK/github.com/juju/juju/state.a
/tmp/benchjuju.bb48b86-p4.txt:14.70 14.83 0.31 /home/dfc/go/pkg/tool/linux_amd64/compile -o $WORK/github.com/juju/juju/state.a
/tmp/benchjuju.bb48b86-p4.txt:14.81 15.10 0.27 /home/dfc/go/pkg/tool/linux_amd64/compile -o $WORK/github.com/juju/juju/state.a
/tmp/benchjuju.bb48b86-p4.txt:14.94 15.21 0.31 /home/dfc/go/pkg/tool/linux_amd64/compile -o $WORK/github.com/juju/juju/state.a
Dave Cheney
Dave Cheney
.png?part=0.1&view=1)
(i have no idea why google sheets is determined to export a postage stamp sized image)
Dave Cheney

Adam Strzelecki
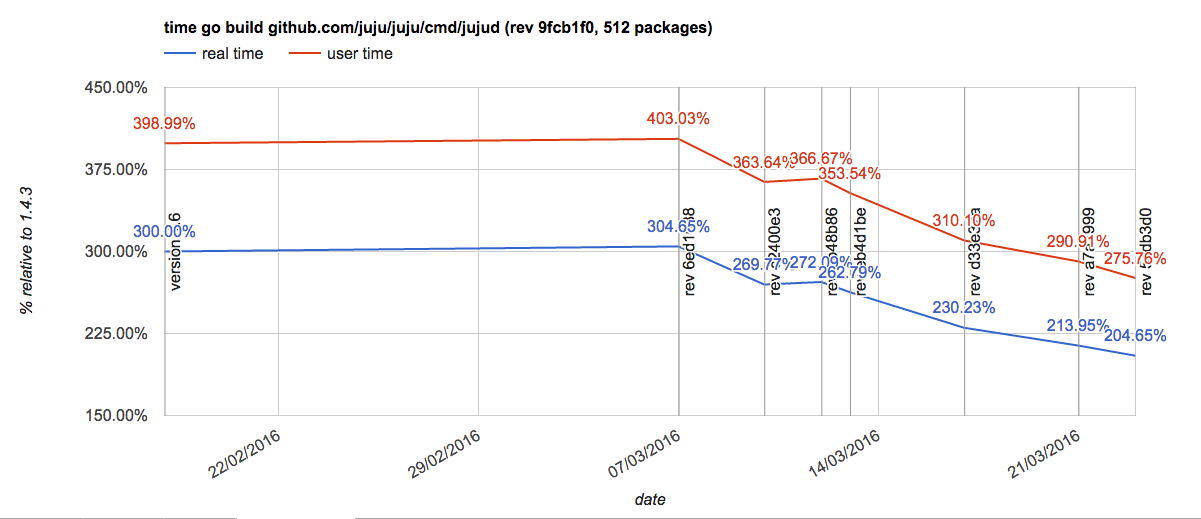
Good news everyone! After a month's work the results are really starting to pay off. The following is a graph of real and user time relative to 1.4.3. Both real and user time is trending downwards. Real time is just above 200% relative to 1.4.3, and both real and user time are trending downwards at the same rate.
Dave Cheney
a performance pain point.
Adam Strzelecki
I'm using linux. I know that macho generation in the darwin linker is
a performance pain point.
Dave Cheney
--
Adam Strzelecki
OS X 10.11.4 i5-4258U CPU @ 2.40GHz 2 core
   version        real   user   sys  real/1.4.3go 1.4.3         10.93  19.88  4.08  --go 1.5.3         22.32  54.68  4.87  2.04xgo 1.6           21.87  52.19  4.88  2.00xgo 1.7 d8ee180   16.98  40.72  4.08  1.55x
Linux 3.16 E5-1650v2 @ 3.50GHz 6 core
   version        real   user   sys  real/1.4.3go 1.4.3          4.78  12.87  2.06  --go 1.5.3         10.83  44.82  2.51  2.27xgo 1.6           10.76  42.56  2.30  2.25xgo 1.7 d8ee180    8.77  33.64  2.02  1.83x
Cheers,
Dave Cheney
--
Dave Cheney
gogs has many build options. Could you please post the complete list
of steps you used to build gogs so I can turn that into a benchmark
suite.
Thanks
Adam Strzelecki
gogs has many build options. Could you please post the complete list
of steps you used to build gogs so I can turn that into a benchmark
suite.

anca.e...@gmail.com

Andrew Gerrand
I think this benchmark must be executed automatically, and included in CI.
David Chase
--
Dave Cheney
I put together
https://github.com/davecheney/benchgogs
and I see on my linux/amd64 machine roughly
go version go1.4.2 linux/amd64
real 0m8.259s
user 0m17.618s
sys 0m2.517s
go version devel +4b209db Thu Mar 31 02:54:10 2016 +0000 linux/amd64
real 0m16.313s
user 0m44.641s
sys 0m2.305s
Which is consistent with the numbers I posted on twitter yesterday.
Please try this benchmark out and send any corrections you wish via PR.

frank.s...@gmail.com
Dave Cheney
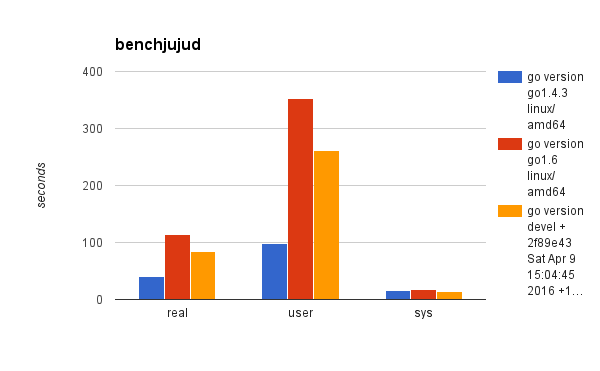
As things are getting colder in Australia it is become more
complicated to get my test machine up to temperature that matches the
values taken previously. To counter this I've changed my benchmark
methodology to run 1.4.3, 1.6 and tip in a loop until all three values
stabalise. Here is a graph of the current state of play.
andrewc...@gmail.com
Good work.

Ugorji
Thanks so much for running this regularly for the group and sharing with us.
Did you run with GOGC=off or a high number (>400). It will be nice to see a column bar for development with GC less aggressive or off, to see clearly how much of an impact GC has.
Thanks.
Dave Cheney
about 20 seconds of real time. Disabling the gc is not a practical
strategy in general.
>
> Thanks.
anca.e...@gmail.com

Seb Binet
There are some opinions about how feasible is https://github.com/gonum/plot to this job, on gonum-dev list.
Dave Cheney
export/import the default, and a few followups from khr the time to
build jujud compared to 1.4.3 is now solidly below 2x.

Manlio Perillo
Hello,By a quirk of fate, the juju codebase has had to maintain compatibility with go 1.2 since that release. This afternoon I did an experiment compiling and linking our biggest command, 512 packages in total, with the latest release compiler from each minor revision.The raw results are here, along with a graph on the second tab. The test machine was a thinkpad x220, Intel(R) Core(TM) i5-2520M CPU @ 2.50GHz, 8gb of ram, everything running out of a ramdisk on /tmp.
https://docs.google.com/spreadsheets/d/1mczKWp3DUuQvIAwZiORD29j5LRb96QZC4mZDn72gAE4/edit?usp=sharingI have heard rumours that others are also collecting benchmark data, but they may not have access to such a pathological data set as juju :) I intend to keep this data set current for as long as I have access to this machine.ThanksDave
Dave Cheney
--