How to draw a 2D human body?

Ramiro Magno

Ron Crump
> I am not even sure if the ggplot2 is the appropriate tool in the R
> ecosystem for this task, so feel free to suggest to look elsewhere if
> that makes more sense.
which is where they encourage people to ask their ggplot questions
these days (Hadley Wickham works at RStudio), but also because
you may be able to get more discussion going there as you don't
have a specific problem that you need help with. You might want
to describe what you want to achieve and why to engage with people
though.
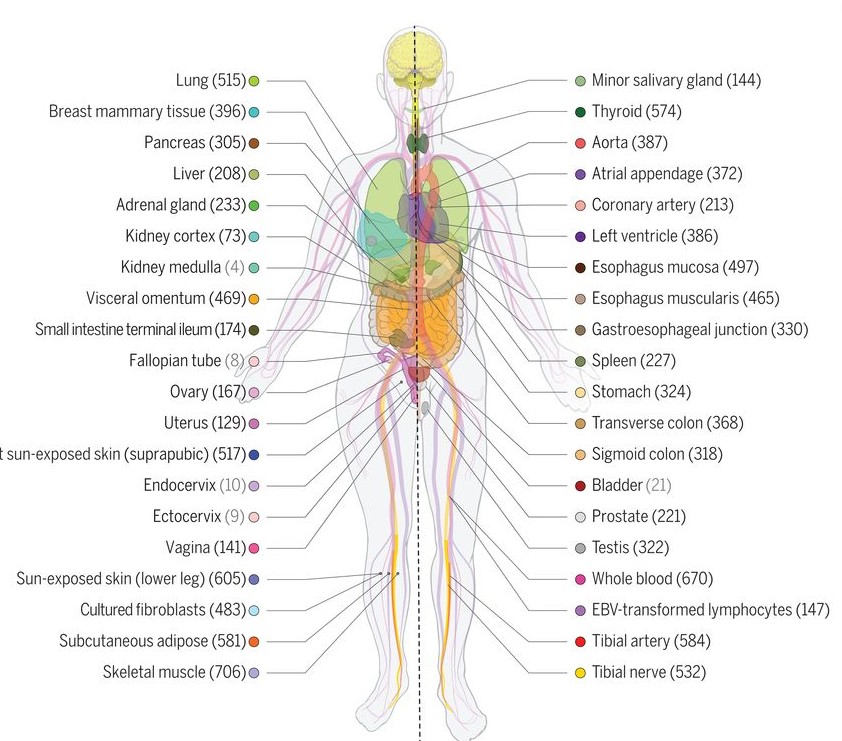
> Very simply, I'd like to draw graphics such as this human body:
>
Pretty. But why? A one off? Or do you need to regularly draw
human bodies with different bits highlighted or filled in
accordance with some data?
> I have in mind bodies of other species too. So would there be a
> mechanism to make the model in SVG, and then somehow implement a geom
> for it??
of the elements (you'd need to get the coordinates from the image).
But why do you want to do this in ggplot? If I were doing it
I'd try bitmap tracing in inkscape then manually refining it there.
Or, as a LaTeX user, I'd think about getting it from inkscape as
TiKz code if I wanted to be able to include it my LaTeX documents
frequently.
Not sure what value a geom would have. You might need to describe
what use case you see for it.
> Does it even make any sense?
that I'd never have thought of doing.
Best wishes,
Ron

Konstantinos L. Papageorgiou
you can either treat the body as background image, either raster or
scalable as statoc
https://rpkgs.datanovia.com/ggpubr/reference/background_image.html
https://stackoverflow.com/questions/61387217/use-svg-images-as-symbols-in-gglot2
https://www.stat.auckland.ac.nz/~paul/Reports/grImport/grimport-gridsvg-export/grimport-gridsvg-export.html
or if you have the human body as coordinates you can also fully plot it.
Ramiro Magno
Konstantinos L. Papageorgiou
Hi Ramiro,
interesting project u have there..
So yes certainly you can make all these in ggplot.
the geomery you need is called geom_polygon
https://ggplot2.tidyverse.org/reference/geom_polygon.html
for each "comic" drawing that is decomposed into polygons having a
different class
imagine data of the form x,y, class
x,y denote the point of the polygon and the class some string to
group the points together as well as denote the color during
drawing.
Your task is very close to drawing world maps.
data.tables and ggplot would most probably be your two close
friends in this
with ggplot there is nearly nothing you can't do and at the same
time render on svg, pdf, png ....
--
--
You received this message because you are subscribed to the ggplot2 mailing list.
Please provide a reproducible example: https://github.com/hadley/devtools/wiki/Reproducibility
To post: email ggp...@googlegroups.com
To unsubscribe: email ggplot2+u...@googlegroups.com
More options: http://groups.google.com/group/ggplot2
---
You received this message because you are subscribed to the Google Groups "ggplot2" group.
To unsubscribe from this group and stop receiving emails from it, send an email to ggplot2+u...@googlegroups.com.
To view this discussion on the web visit https://groups.google.com/d/msgid/ggplot2/CAFHVhtCxPbxzvAVWapKX-6hL7CkjS3ktF3fUtLKV0WQv6%3DQveQ%40mail.gmail.com.
Ramiro Magno

Manuel Spínola
--
--
You received this message because you are subscribed to the ggplot2 mailing list.
Please provide a reproducible example: https://github.com/hadley/devtools/wiki/Reproducibility
To post: email ggp...@googlegroups.com
To unsubscribe: email ggplot2+u...@googlegroups.com
More options: http://groups.google.com/group/ggplot2
---
You received this message because you are subscribed to the Google Groups "ggplot2" group.
To unsubscribe from this group and stop receiving emails from it, send an email to ggplot2+u...@googlegroups.com.
To view this discussion on the web visit https://groups.google.com/d/msgid/ggplot2/b2f4e683-3979-40fb-9415-192a8db16207n%40googlegroups.com.
Instituto Internacional en Conservación y Manejo de Vida Silvestre
Universidad Nacional
Apartado 1350-3000
Heredia
COSTA RICA
mspi...@una.cr
mspin...@gmail.com
Teléfono: (506) 8706 - 4662
Personal website: Lobito de río
Institutional website: ICOMVIS
Ramiro Magno
Konstantinos L. Papageorgiou
nice thanks for keeping us in the loop
To view this discussion on the web visit https://groups.google.com/d/msgid/ggplot2/CAFHVhtBdkv0cDtS_EqQeV2V0CZ5AYBLqSs_sapuDhEzHQ5Orpg%40mail.gmail.com.
Konstantinos L. Papageorgiou
Also stumbled on this which potentially could allow you to import
any svg you may found in the net and then do whatever you like
with ggplot
- https://rdrr.io/cran/StratigrapheR/man/pointsvg.html
To view this discussion on the web visit https://groups.google.com/d/msgid/ggplot2/CAFHVhtB94gGDi8V1mL1NShaJo3e-vknEEawaVXq4zvPopzugJw%40mail.gmail.com.
Ramiro Magno

Kamil Slowikowski
- Interactive app: http://sbb.cellfinder.org/
- Home page: https://semantic-body-browser.lekschas.de/
- Source code: https://github.com/flekschas/sbb

Ramiro Magno
You received this message because you are subscribed to a topic in the Google Groups "ggplot2" group.
To unsubscribe from this topic, visit https://groups.google.com/d/topic/ggplot2/zaPGNS3g3Ko/unsubscribe.
To unsubscribe from this group and all its topics, send an email to ggplot2+u...@googlegroups.com.
To view this discussion on the web visit https://groups.google.com/d/msgid/ggplot2/aa41de2a-7196-479f-a3b0-73dafe1de4a5n%40googlegroups.com.
Kamil Slowikowski