too many white blank in donuts plot
34 views
Skip to first unread message

jinwen zhang
Sep 10, 2021, 7:43:14 AM9/10/21
to ggplot2
Hi, everyone. I'd tried my best to adjust my plots, but there is no idea to solve my problem.
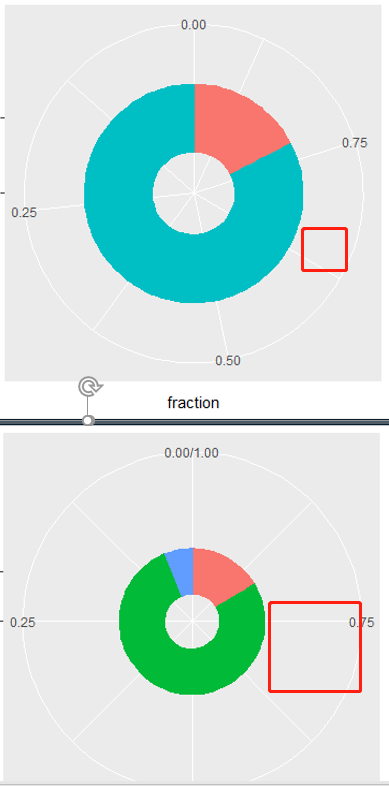
My plots are list below
Here is my codes
#
plot_tbl <- data.frame(transcript_id = c("x", "x", "x"), color = 1:3, fraction = c(0.15, 0.7, 0.15))
ggplot(plot_tbl, aes(x = transcript_id, y = fraction,
fill= color, color = color)) +
scale_x_discrete(limits = c(" ", as.character(plot_tbl$transcript_id))) +
geom_col(position = position_stack(1), width = 1, show.legend = FALSE) +
coord_polar("y", direction = -1, start = 0)
#
plot_tbl <- plot_tbl[1:2, ]
ggplot(plot_tbl, aes(x = transcript_id, y = fraction,
fill= color, color = color)) +
scale_x_discrete(limits = c(" ", as.character(plot_tbl$transcript_id))) +
geom_col(position = position_stack(1), width = 1, show.legend = FALSE) +
coord_polar("y", direction = -1, start = 0)
jinwen zhang
Sep 16, 2021, 12:52:41 AM9/16/21
to ggplot2
My fault.
I was too careless and forgot to use `unique` groups.
So, the right way should be
scale_x_discrete(limits = c(" ", unique(as.character(plot_tbl$transcript_id))))
Reply all
Reply to author
Forward
0 new messages