facet errors

Jason Law
data(mpg)
qplot(mpg, wt, data=mtcars, facets = vs + cyl ~ . )
and am getting this error:
Error in .$scales$y[[i]] : subscript out of bounds
I'm assuming this is because of the missing levels in vs:cyl, since vs
+ am ~ . works. Is this a known limitation or is this a bug for
factors with sparse interactions? Does anyone know of a workaround?

Brian Diggs
You get the same error if you use the ggplot version of the call:
ggplot(mtcars, aes(x=mpg, y=wt)) + geom_point() +
facet_grid(vs + cyl ~ .)
# Error in .$scales$y[[i]] : subscript out of bounds
I'm guessing that you are right about the cause. I didn't know about
the bug, but there is one filed about it
https://github.com/hadley/ggplot2/issues/165
As a workaround, you can make sure that the data has every combination,
even if it is missing data and thus will get dropped from the plot (with
a warning):
mtcars2 <- rbind.fill(mtcars,
expand.grid(vs=unique(mtcars$vs), cyl=unique(mtcars$cyl)))
ggplot(mtcars2, aes(x=mpg, y=wt)) + geom_point() +
facet_grid(vs + cyl ~ .)
You get a warning message about every facet removing one row of missing
values, but at least it plots.
--
Brian S. Diggs, PhD
Senior Research Associate, Department of Surgery
Oregon Health & Science University
Jason Law
I'm trying to keep the plots all vertical so that it is easy to compare relative values for each PSU, but I'd like two factors on the facet rather than just one.
Jason Law
Statistician
City of Portland, Bureau of Environmental Services
Water Pollution Control Laboratory
6543 N Burlington Avenue
Portland, OR 97203-5452

Joshua Wiley
What about creating the combined factor manually?
require(ggplot2)
mtcars <- within(mtcars, {
carb <- as.factor(carb)
carb <- reorder(reorder(carb, as.numeric(cyl)), as.numeric(vs))
})
mtcars$mygrid <- apply(mtcars[, c("vs", "cyl")], 1, paste, collapse = '')
ggplot(mtcars, aes(x = wt, y = carb)) +
geom_point(aes(shape = factor(gear), colour = factor(am))) +
facet_grid(mygrid ~ ., space = 'free', scales = 'free_y')
I am sure there are ways to improve the strip labels, but I wanted to
check that that is actually what you want first.
Cheers,
Josh
On Tue, Jun 21, 2011 at 4:03 PM, Jason Law <jason...@gmail.com> wrote:
>
> Thanks for the tip. Unfortunately, the plot I'm trying to do is more like:
> mtcars <- within(mtcars, {
> carb <- as.factor(carb)
> carb <- reorder(reorder(carb, as.numeric(cyl)), as.numeric(vs))
> })
> ggplot(mtcars, aes(x=wt, y=carb)) +
> geom_point() +
> facet_grid(vs + cyl ~ ., space = 'free', scales = 'free_y')
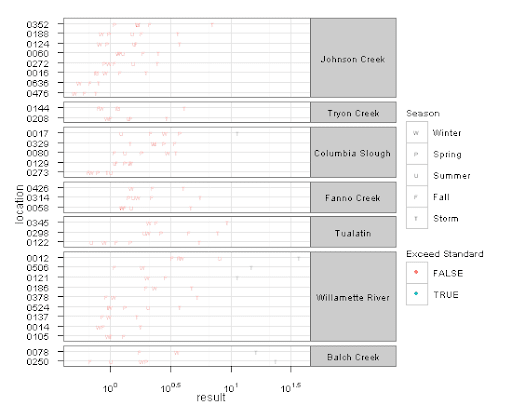
> The data is sample survey data with multiple observations per PSU. The facet variables I'm using are a subdomain and the strata. For some subdomains, there is only data in one strata and there are variable numbers of PSUs per level of subdomain:strata. The actual plot I'm attempting looks like this where the labels on the right are the subdomains:
>
> I'm trying to keep the plots all vertical so that it is easy to compare relative values for each PSU, but I'd like two factors on the facet rather than just one.
>
> Jason Law
>
> Statistician
>
> City of Portland, Bureau of Environmental Services
>
> Water Pollution Control Laboratory
>
> 6543 N Burlington Avenue
>
> Portland, OR 97203-5452
>
>
> --
> You received this message because you are subscribed to the ggplot2 mailing list.
> Please provide a reproducible example: http://gist.github.com/270442
>
> To post: email ggp...@googlegroups.com
> To unsubscribe: email ggplot2+u...@googlegroups.com
> More options: http://groups.google.com/group/ggplot2
--
Joshua Wiley
Ph.D. Student, Health Psychology
University of California, Los Angeles
http://www.joshuawiley.com/