Alpha error in Legend?
12 views
Skip to first unread message

cool.abbecker
Jun 15, 2017, 4:35:11 PM6/15/17
to ggplot2
ggplot(
) +
geom_bar(
width=1,
dat=subset(temp,variable=="spec_h_blast1"),
aes(x=fam,y=value,fill=variable),
stat="identity",
position="identity",
color="black"
) +
etc ....................
) +
scale_fill_manual(
name=NULL,
labels=NULL,
values=c("#6a4a3c",alpha("#6a4a3c",0),"#00A0B0",alpha("#00A0B0",0.1),"#EDC951",alpha("#EDC951",0.1))
) +
theme(
legend.position = c(0,.5),
legend.justification = c(1,1),
legend.key=element_blank()
)
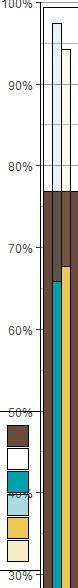
Works ... but looks shitty
If I set apha to 0.5, the legend becomes unreadable. values=c("#6a4a3c",alpha("#6a4a3c",0),"#00A0B0",alpha("#00A0B0",0.5),"#EDC951",alpha("#EDC951",0.5))
The alpha level in the legend seems to be different from the plot.
I did not ever set the parameter alpha anywhere else in the ehole plot.
Known bug?
) +
geom_bar(
width=1,
dat=subset(temp,variable=="spec_h_blast1"),
aes(x=fam,y=value,fill=variable),
stat="identity",
position="identity",
color="black"
) +
etc ....................
) +
scale_fill_manual(
name=NULL,
labels=NULL,
values=c("#6a4a3c",alpha("#6a4a3c",0),"#00A0B0",alpha("#00A0B0",0.1),"#EDC951",alpha("#EDC951",0.1))
) +
theme(
legend.position = c(0,.5),
legend.justification = c(1,1),
legend.key=element_blank()
)
Works ... but looks shitty
If I set apha to 0.5, the legend becomes unreadable. values=c("#6a4a3c",alpha("#6a4a3c",0),"#00A0B0",alpha("#00A0B0",0.5),"#EDC951",alpha("#EDC951",0.5))
The alpha level in the legend seems to be different from the plot.
I did not ever set the parameter alpha anywhere else in the ehole plot.
Known bug?
cool.abbecker
Jun 15, 2017, 5:45:52 PM6/15/17
to ggplot2
Still not sure what is going on, but
guides(
fill=guide_legend(nrow=2,override.aes = list(alpha = c(1,0.25,1,0.1,1,0.1)))
)
produced the results I was looking for. Although this should not be necessary.
guides(
fill=guide_legend(nrow=2,override.aes = list(alpha = c(1,0.25,1,0.1,1,0.1)))
)
produced the results I was looking for. Although this should not be necessary.
Reply all
Reply to author
Forward
0 new messages