Applying different nls models to different facets/groups using geom_smooth
1,007 views
Skip to first unread message

Hefin Rhys
Dec 20, 2016, 11:19:44 AM12/20/16
to ggplot2
Hi all, suppose I have a data frame:
and I want to plot the data as Result vs Time, facetting by Group. I want to draw nls models to the plots using geom_smooth which when applying to only one group at a time (A) works well:
But the problem I face is that I only understand how to specify one formula, and one set of starting values in the call to geom_smooth, so if I want to draw models with very different formulae or starting values, I can't. For example, here if I try to draw a separate model for each facet/group, it fails on one of the facets:
So my question is when applying geom_smooth by a grouping/facetting variable, is there a way to specify separate models? Or is the only option to simply model each in isolation and then use something like gridExtra to panel them together again afterwards?
As an off topic aside, the nls() function is really bad at parameter estimation. There are online widgets which can estimate parameters without any user defined starting values, so why is nls() so far behind? Am I missing something?
Thanks
Hefin
df <- data.frame(Group = c(rep("A", 7), rep("B", 7), rep("C", 7)),
                 Time = c(rep(c(1:7), 3)),
                 Result = c(100, 96.9, 85.1, 62.0, 30.7, 15.2, 9.6,
                            10.2, 14.8, 32.26, 45.85, 56.25, 70.1, 100,
                            100, 55.61, 3.26, -4.77, -7.21, -3.2, -5.6))
and I want to plot the data as Result vs Time, facetting by Group. I want to draw nls models to the plots using geom_smooth which when applying to only one group at a time (A) works well:
ggplot(data = df[df$Group == "A",], aes(x = Time, y = Result)) +
  facet_wrap(~ Group) +
  geom_point() +
  geom_smooth(method = "nls", formula = y ~ a+(b-a)/(1+(x/c)^d), se = FALSE,
              method.args = list(start = c(a = -3, b = 85, c = 4, d = 10)))
But the problem I face is that I only understand how to specify one formula, and one set of starting values in the call to geom_smooth, so if I want to draw models with very different formulae or starting values, I can't. For example, here if I try to draw a separate model for each facet/group, it fails on one of the facets:
ggplot(data = df, aes(x = Time, y = Result)) +
  facet_wrap(~ Group) +
  geom_point() +
  geom_smooth(method = "nls", formula = y ~ a+(b-a)/(1+(x/c)^d), se = FALSE,
              method.args = list(start = c(a = -3, b = 85, c = 4, d = 10)))
So my question is when applying geom_smooth by a grouping/facetting variable, is there a way to specify separate models? Or is the only option to simply model each in isolation and then use something like gridExtra to panel them together again afterwards?
As an off topic aside, the nls() function is really bad at parameter estimation. There are online widgets which can estimate parameters without any user defined starting values, so why is nls() so far behind? Am I missing something?
Thanks
Hefin

Brandon Hurr
Dec 20, 2016, 11:40:59 AM12/20/16
to Hefin Rhys, ggplot2
I don't have time to look into this right now but as a guide this feels very purrr/broom to me.
Maybe read the broom package vignette and r4ds.hadley.nz purrr section on multiple models.
I think split the dataframe apply the various models as a list using map(), extract the models and apply them as facets. I've never done this whole process since I haven't had a need, but there's lots of stuff on stackoverflow too.
HTH,
B
--
--
You received this message because you are subscribed to the ggplot2 mailing list.
Please provide a reproducible example: https://github.com/hadley/devtools/wiki/Reproducibility
To post: email ggp...@googlegroups.com
To unsubscribe: email ggplot2+u...@googlegroups.com
More options: http://groups.google.com/group/ggplot2
---
You received this message because you are subscribed to the Google Groups "ggplot2" group.
To unsubscribe from this group and stop receiving emails from it, send an email to ggplot2+u...@googlegroups.com.
For more options, visit https://groups.google.com/d/optout.
Brandon Hurr
Jan 1, 2017, 1:35:37 PM1/1/17
to Hefin Rhys, ggplot2
Hefin,
I tried to solve this over the break a few times and couldn't get it myself so I reached out on Twitter and StackOverflow. Jenny Bryan used map2 and pmap to derive the solution to the setting start parameters independently for each model.
The output after this is the models in a list-column.
Sadly, plotting these models from here isn't as easy as I had hoped because there is an indication that you can't facet functions:
It says to use the functions to estimate values along the range of your data and plot those lines. Putting it all together it looks like this: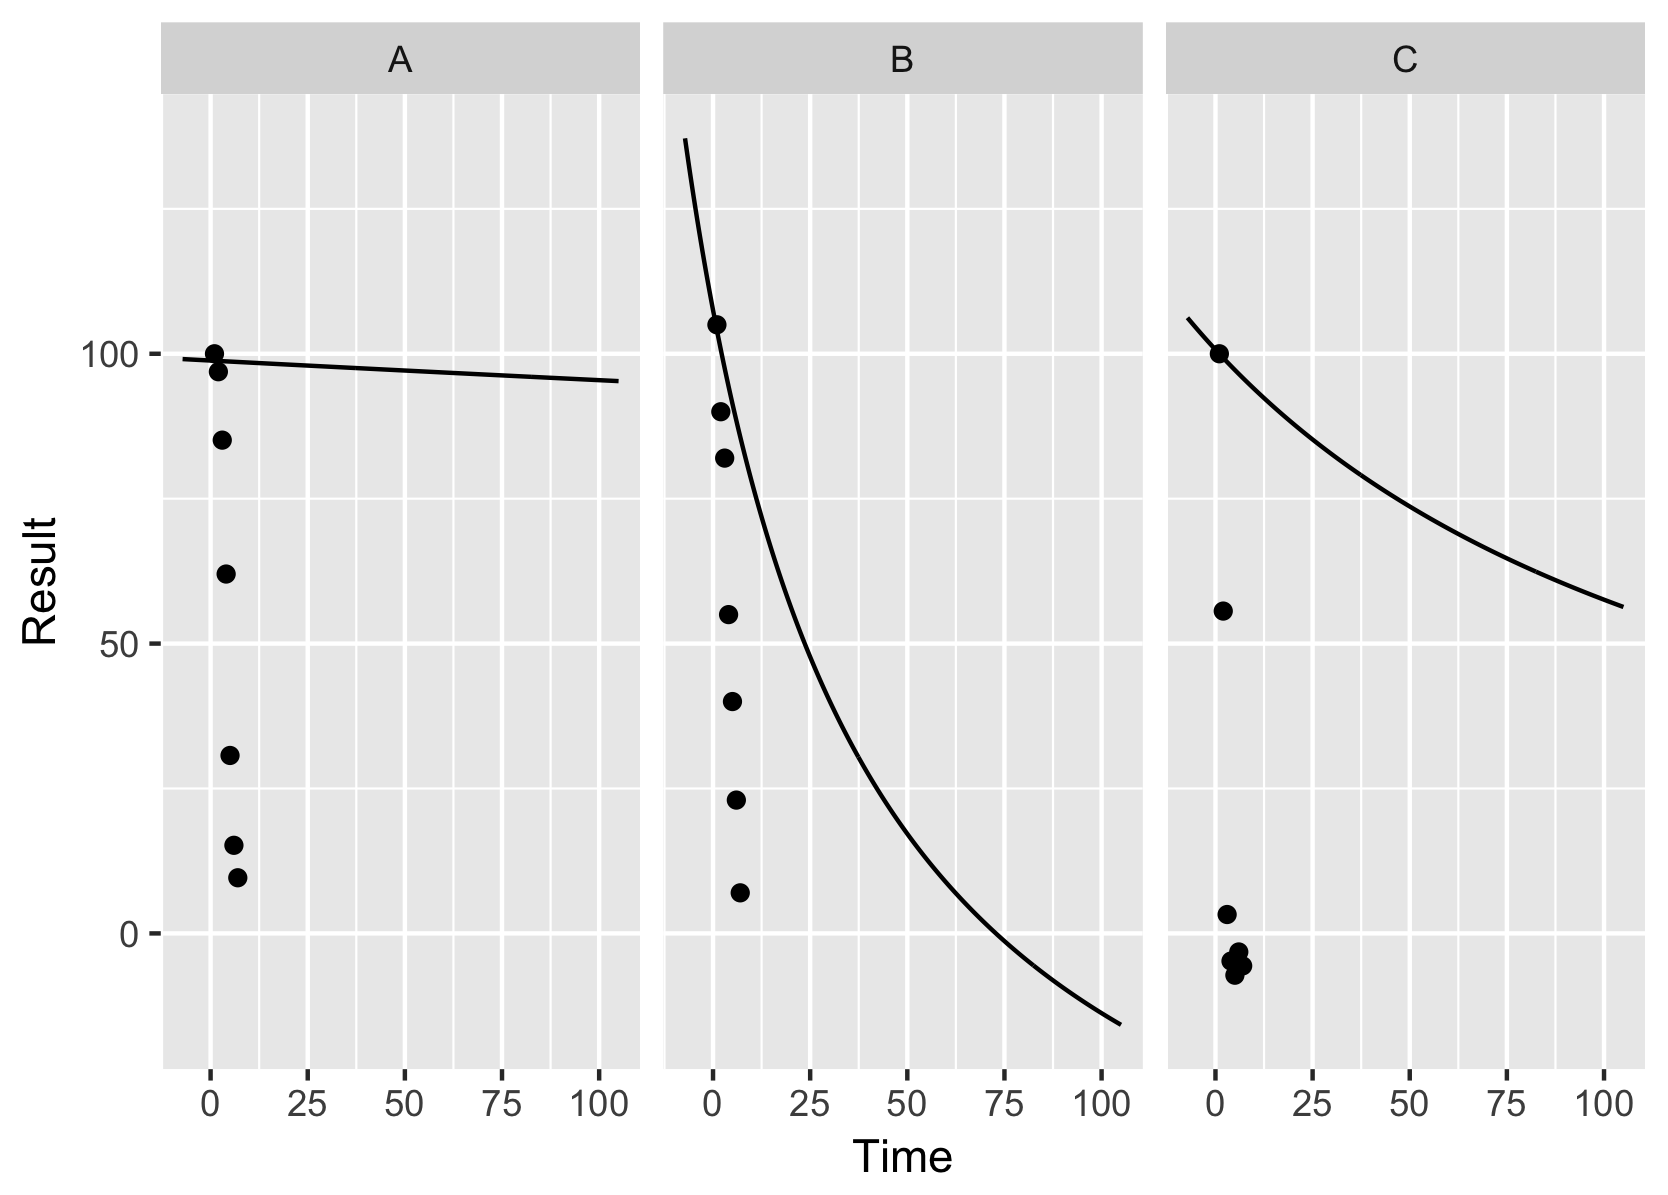
This indicates that your starting values are bad and in order for this to work at all, Jenny replaced your B group values because with those start values, it failed miserably (or perhaps an nls is a bad choice for that data?).
I don't know how to estimate start values automatically. Perhaps others do?
library(tidyverse)
# input data frame
df <- tibble(Group = c(rep("A", 7), rep("B", 7), rep("C", 7)),
Time = c(rep(c(1:7), 3)),
Result = c(100, 96.9, 85.1, 62.0, 30.7, 15.2, 9.6,
## Jenny Bryan (I) replaced these values!!
## Group B initial values are NOT MY PROBLEM
105, 90, 82, 55, 40, 23, 7,
100, 55.61, 3.26, -4.77, -7.21, -3.2, -5.6))
## ggplot(df, aes(x = Time, y = Result, group = Group)) + geom_line()
df_p <-
df %>%
group_by(Group) %>%
#nest the values for modeling
nest() %>%
## init vals are all the same, but this shows how to make them different
mutate(start = list(
list(a = -3, b = 85, c = 4, d = 10),
list(a = -3, b = 85, c = 4, d = 10),
list(a = -3, b = 85, c = 4, d = 10)),
# model using nls and start values defined above
model = map2(data, start,
~ nls(Result ~ a+(b-a)/(1+(Time/c)^d),
data = .x, start = .y)),
# model quality measurements
glance = map(model, broom::glance),
# contains parameters from model
tidy = map(model, broom::tidy),
# estimates and errors
augment = map(model, broom::augment)
)
# create tibble with 250 points along "Time" for each model
lineplot = tibble(Group = rep(df_p$Group, each=250), x = rep(seq(min(df$Result), max(df$Result), len=250), length(df_p$Group)))
# pull out the model parameter estimates and spread them wide for computing
ModelParams <-
unnest(df_p, tidy) %>%
select(1:3) %>%
spread(term, estimate)
# compute model estimates for plotting
Modelline <-
lineplot %>%
full_join(ModelParams, .) %>%
mutate(y = (a+(b-a)/(1+x/c^d)))
# plot and facet with model
ggplot() +
# original points
geom_point(data = df, aes(x = Time, y = Result)) +
# model lines for plotting
geom_line(data = Modelline, aes(x = x, y = y)) +
facet_grid(~Group)
HTH
B
To unsubscribe: email ggplot2+unsubscribe@googlegroups.com
More options: http://groups.google.com/group/ggplot2
---
You received this message because you are subscribed to the Google Groups "ggplot2" group.
To unsubscribe from this group and stop receiving emails from it, send an email to ggplot2+unsubscribe@googlegroups.com.
Reply all
Reply to author
Forward
0 new messages