Shifting the NA label to the top of the legend
87 views
Skip to first unread message

gafna jeff
Sep 14, 2021, 7:48:19 AM9/14/21
to ggplot2
Hello everybody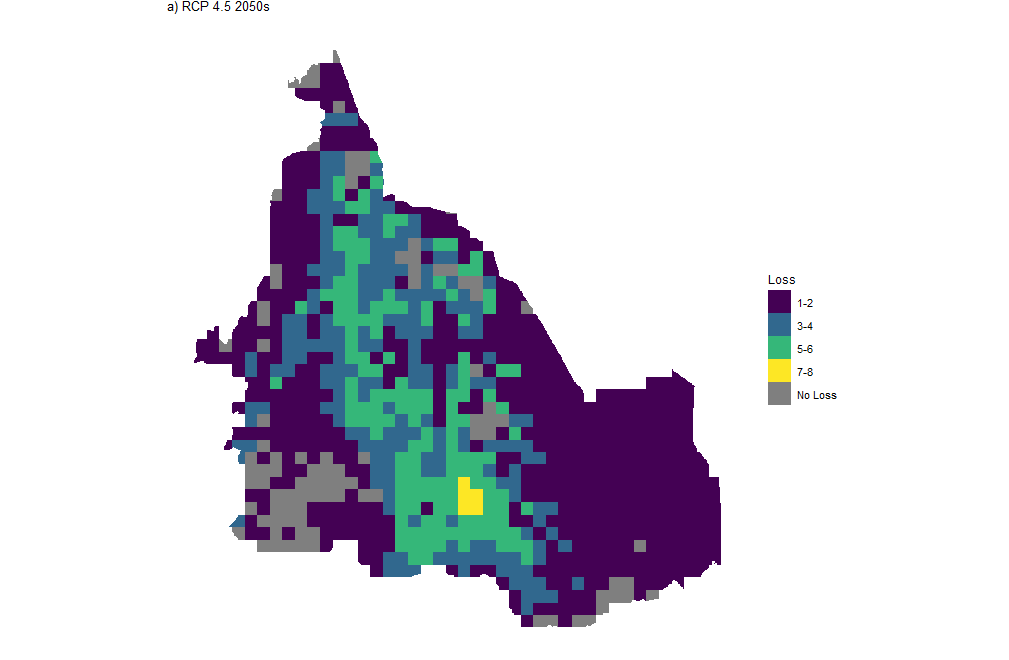
Am having a problem shifting the "NA or no loss" in by map to the top of the legend. It should read like : No loss, 1-2, 3-4, 5-6, .. How can I do this. Attached is my code, current map. Am unable to attach the raster but am willing to send it out privately. I would really appreciate your help.
library(raster)
library(sp)
library(sf)
library(ggplot2)
library(ggspatial)
library(viridis)
library(tidyverse)
######Plot and see all Losses under all scenarios
###plot loss in species richness under RCP 4.5_2050s
loss_4550 <- raster("Outputs/all_final_rasters/species/loss_masked_RCP4550s.tif")
plot(loss_4550)
# convert to a df for plotting in two steps,
# First, to a SpatialPointsDataFrame
loss_4550_pts <- rasterToPoints(loss_4550, spatial = TRUE)
# Then to a 'conventional' dataframe
loss_4550_df <- data.frame(loss_4550_pts)
rm(loss_4550_pts, loss_4550)
names(loss_4550_df)
DSM_HARV_df_2 <- loss_4550_df %>%
mutate(fct_elevation_3 = cut(loss_masked_RCP4550s, breaks = 5))
#If we want to know the cutoff values for the groups, we can ask for the unique values of fct_elevation:
unique(DSM_HARV_df_2$fct_elevation_3)
#And we can get the count of values in each group using dplyr’s group_by() and count() functions:
DSM_HARV_df_2 %>%
group_by(fct_elevation_3) %>%
count()
#prepare breaks. To implement this we will give mutate() a numeric vector of break points instead of the number of breaks we want.
custom_bins_2 <- c(0,2,4,6,7)
DSM_HARV_df_2 <- DSM_HARV_df_2 %>%
mutate(fct_elevation_4 = cut(loss_masked_RCP4550s, breaks = custom_bins_2))
unique(DSM_HARV_df_2$fct_elevation_4)
ggplot() +
geom_bar(data = DSM_HARV_df_2, aes(fct_elevation_4))
names(DSM_HARV_df_2)
class(DSM_HARV_df_2)
summary(DSM_HARV_df_2)
ggplot() +
geom_raster(data = DSM_HARV_df_2 , aes(x = x, y = y, fill = fct_elevation_4)) +
scale_fill_manual(values = viridis(4, option = "viridis"), na.value = "grey50", name = "Loss", labels = c("1-2", "3-4", "5-6", "7-8", "No Loss")) + ggtitle("a) RCP 4.5 2050s") + theme(axis.title.x = element_blank(), axis.title.y = element_blank()) + theme(plot.title=element_text(size=10)) + theme(axis.title.x = element_blank(), axis.title.y = element_blank()) + coord_quickmap() + theme(panel.border = element_rect(colour = "black", fill="NA", size=1)) + theme(plot.margin = unit(c(0, 0, 0, 0), "lines")) + theme(legend.title = element_text(size = 9), legend.text = element_text(size = 8)) + theme(panel.background = element_rect(fill = "white", color = "white")) + theme(panel.border = element_blank(), axis.text = element_blank(), panel.grid = element_blank(), axis.ticks = element_blank())

Konstantinos L. Papageorgiou
Sep 14, 2021, 9:18:34 AM9/14/21
to ggp...@googlegroups.com
hi, have a look at ordered factors
https://www.dummies.com/programming/r/how-to-work-with-ordered-factors-in-r/
--
--
You received this message because you are subscribed to the ggplot2 mailing list.
Please provide a reproducible example: https://github.com/hadley/devtools/wiki/Reproducibility
To post: email ggp...@googlegroups.com
To unsubscribe: email ggplot2+u...@googlegroups.com
More options: http://groups.google.com/group/ggplot2
---
You received this message because you are subscribed to the Google Groups "ggplot2" group.
To unsubscribe from this group and stop receiving emails from it, send an email to ggplot2+u...@googlegroups.com.
To view this discussion on the web visit https://groups.google.com/d/msgid/ggplot2/71292242-7f6d-4ce7-9545-15dd4e643a9an%40googlegroups.com.
Reply all
Reply to author
Forward
0 new messages