GGPLOT: geom_rect and facet

MARIA RODRIGUEZ SANZ
Dear all,
Does anybody know how can I avoid colour transparency (alpha) changing with geom_rect function?
I would like to have the same colour and transparency in all the graphs.
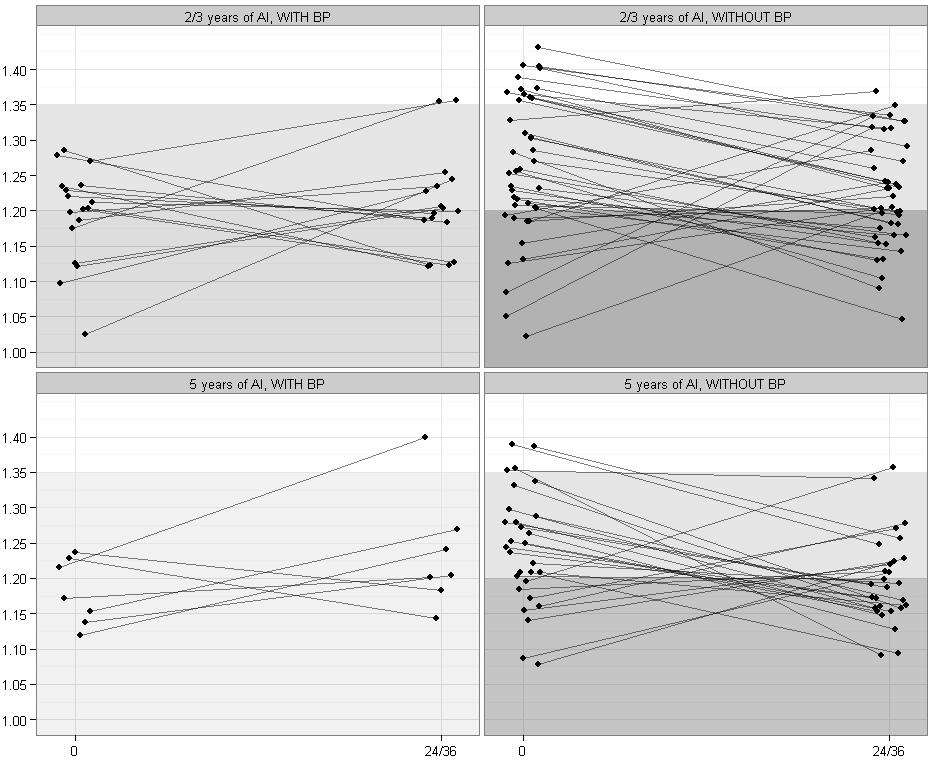
This is the result of my syntax: :(
ggplot(data=base_lumbar, aes(x=tiempo, y=perdida_lumbar, group=interaction(dna, as.factor(añosia)))) +
geom_point(aes(colour=as.factor(añosia)),size=2, position=position_dodge(width=0.1)) +
geom_line(aes(colour=as.factor(añosia)),size=0.5, alpha=0.5, position=position_dodge(width=0.1)) +
facet_wrap(añosia ~ tvsnt)+
scale_y_continuous(limits=c(1,1.44),breaks=seq(1, 1.44, 0.05)) +
scale_x_discrete(expand=c(0.05,0.05), labels=c("0", "24/36","60")) +
theme(axis.title.x = element_text(colour="black", size=16, vjust = -1,family="Calibri"),axis.text.x = element_text(size=14,hjust=0.5,family="Calibri",colour="#00008B"))+
theme(axis.title.y = element_text(colour="black", size=16, vjust = 0.2,family="Calibri"), axis.text.y = element_text(size=14,family="Calibri",colour="#00008B"))+
xlab("Time of follow up (months)")+ylab("TBS")+
scale_color_manual(values=c("black", "black"),name="Months of AI treatment",labels=c("24/36","60"))+
geom_rect(xmin = -Inf, xmax = Inf, ymin =-Inf , ymax =1.2, fill = "gray20", alpha=0.002) +
geom_rect(xmin = -Inf, xmax = Inf, ymin =1.2 , ymax =1.35, fill = "gray40", alpha=0.002) +
geom_rect(xmin = -Inf, xmax = Inf, ymin =1.35 , ymax =Inf, fill = "white", alpha=0.002) +
theme_bw()
Thank you very much in advance!
Maria.

romunov
Can you provide a reproducible example? It's not clear to me what you mean by "all the graphs".
Cheers,
Roman
--
--
You received this message because you are subscribed to the ggplot2 mailing list.
Please provide a reproducible example: https://github.com/hadley/devtools/wiki/Reproducibility
To post: email ggp...@googlegroups.com
To unsubscribe: email ggplot2+u...@googlegroups.com
More options: http://groups.google.com/group/ggplot2
---
You received this message because you are subscribed to the Google Groups "ggplot2" group.
To unsubscribe from this group and stop receiving emails from it, send an email to ggplot2+u...@googlegroups.com.
For more options, visit https://groups.google.com/d/optout.

Hadley Wickham
--
--
You received this message because you are subscribed to the ggplot2 mailing list.
Please provide a reproducible example: https://github.com/hadley/devtools/wiki/Reproducibility
To post: email ggp...@googlegroups.com
To unsubscribe: email ggplot2+u...@googlegroups.com
More options: http://groups.google.com/group/ggplot2
---
You received this message because you are subscribed to the Google Groups "ggplot2" group.
To unsubscribe from this group and stop receiving emails from it, send an email to ggplot2+u...@googlegroups.com.
For more options, visit https://groups.google.com/d/optout.