ggplot2 - 'Stacked Bar Chart with Lines'
46 views
Skip to first unread message

RiF
Jul 26, 2020, 5:02:13 PM7/26/20
to ggplot2
I have the following (simplied) data:
which gives
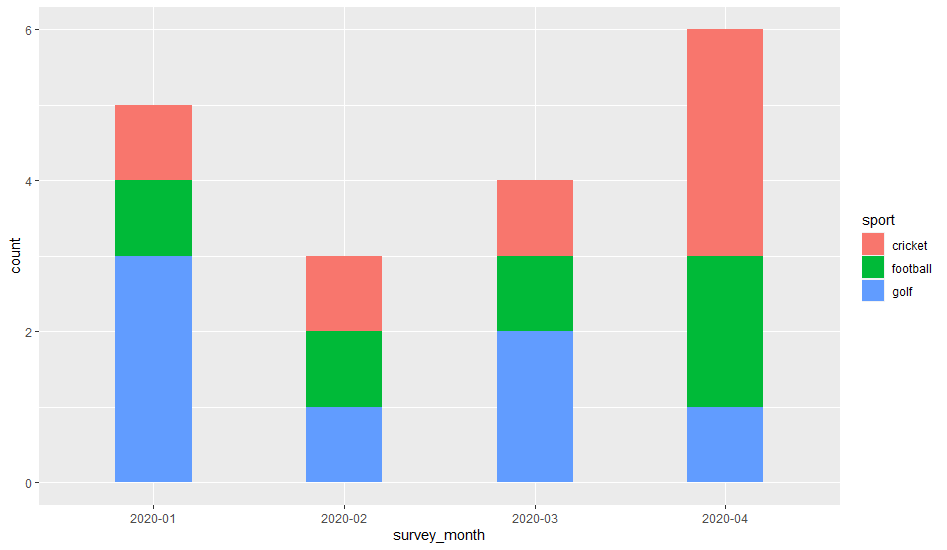
library(ggplot2)survey_month<-c("2020-01", "2020-01","2020-01", "2020-01", "2020-01","2020-02", "2020-02", "2020-02","2020-03", "2020-03", "2020-03","2020-04", "2020-04", "2020-04","2020-04", "2020-04", "2020-04","2020-03" )
sport<-c("golf","golf","golf","cricket","football","golf","cricket","football","golf","cricket","football","golf","cricket","football","cricket","cricket","football","golf" )
df <- data.frame(sport,survey_month)
ggplot(data=df,aes(x=survey_month)) + geom_bar(aes(fill=sport),width=0.4)
which gives
I wish to produce a bar chart, similar to this::
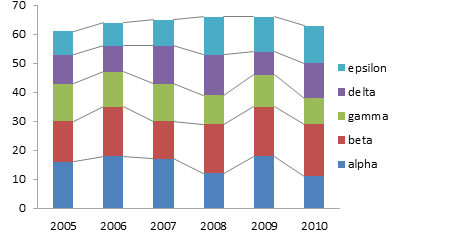
With lines between the bars.
Any suggestions on how to do this in R & ggplot?
Reply all
Reply to author
Forward
0 new messages