Align grid.text to ggplot element?
1,075 views
Skip to first unread message

Tom
Feb 19, 2014, 10:55:45 AM2/19/14
to ggp...@googlegroups.com
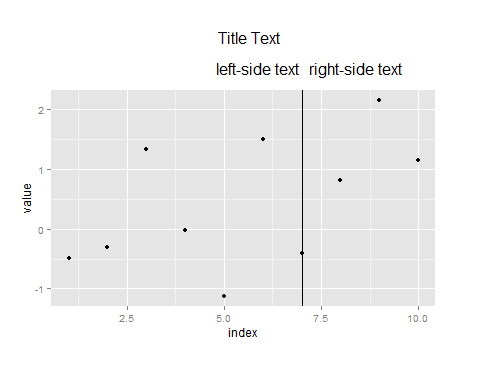
I am attempting to create a chart that will automatically place labels outside of a chart relative to an indicator line (geom_vline, in this case), which is calculated from the supplied data. The final version of the graph will have additional annotation, and so the graph will actually be composed of several viewports, with the ggplot2 plot within one of these. I see four options for doing this:
1. Preferred approach: determine the position of the indicator line (geom_vline) in viewport npc, then draw the text in a separate viewport at the correct position. This is the approach illustrated in the sample code below. Ideally the annotation should be in a separate viewport, but I could place the annotation within the same viewport as the ggplot plot.
2. Draw the text using annotation_custom() and turn off clipping to place the text outside of the plot area. I have figured out how to do this, but would prefer to do the job without turning off clipping as it may cause problems with other annotations.
3. Place the annotation inside the plot area using annotate(), but the annotations will sometimes be drawn overtop some of the data, making the graph difficult to read.
My difficulty is that I cannot figure out how to determine the position of the indicator line (my.vertline, in the code below) relative to the viewport dimensions (npc or otherwise). Thanks in advance for suggestions.
Working sample below:
library(ggplot2)
library(grid)
library(grid)
#' Create the viewports
#' note that the height will not be constant; vp1 will be adjusted
#' based on content selected by the user
#' note that the height will not be constant; vp1 will be adjusted
#' based on content selected by the user
my.vp1 <- viewport(x = 0.5, y = 1, height = 0.2, just = c("centre","top"))
my.vp2 <- viewport(x = 0.5, y = 0, height = 0.8, just = c("centre","bottom"))
my.vp2 <- viewport(x = 0.5, y = 0, height = 0.8, just = c("centre","bottom"))
#' Create some sample data
my.df <- data.frame(index = seq(1:10), value = rnorm(10))
my.vertline <- 7 # will be calculated from the data and stored
my.rightmargin <- 4 # will be calculated from the data to ensure a large enough margin for certain annotations
my.df <- data.frame(index = seq(1:10), value = rnorm(10))
my.vertline <- 7 # will be calculated from the data and stored
my.rightmargin <- 4 # will be calculated from the data to ensure a large enough margin for certain annotations
#' Create the plot object
my.p <- ggplot(data = my.df) +
theme(plot.margin = unit(c(1,my.rightmargin,2,1), "char")) +
geom_point(aes(x = index, y = value)) +
geom_vline(xintercept = my.vertline)
my.p <- ggplot(data = my.df) +
theme(plot.margin = unit(c(1,my.rightmargin,2,1), "char")) +
geom_point(aes(x = index, y = value)) +
geom_vline(xintercept = my.vertline)
my.gt <- ggplot_gtable(ggplot_build(my.p))
#' New graph
grid.newpage()
grid.newpage()
pushViewport(my.vp1)
grid.text("Title Text")
popViewport()
grid.text("Title Text")
popViewport()
#' Now add the labels for the vertical line
#' Position "x" is what we want to calculate from the position of the vline,
#' Position "x" is what we want to calculate from the position of the vline,
#' which we will know.
pushViewport(my.vp1)
grid.text("left-side text", x = 0.61 - 0.01, y = 0, just = c("right","bottom"))
grid.text("right-side text", x = 0.61 + 0.01, y = 0, just = c("left","bottom"))
popViewport()
pushViewport(my.vp1)
grid.text("left-side text", x = 0.61 - 0.01, y = 0, just = c("right","bottom"))
grid.text("right-side text", x = 0.61 + 0.01, y = 0, just = c("left","bottom"))
popViewport()

baptiste auguie
Feb 19, 2014, 6:06:27 PM2/19/14
to Tom, ggplot2
--
--
You received this message because you are subscribed to the ggplot2 mailing list.
Please provide a reproducible example: https://github.com/hadley/devtools/wiki/Reproducibility
To post: email ggp...@googlegroups.com
To unsubscribe: email ggplot2+u...@googlegroups.com
More options: http://groups.google.com/group/ggplot2
---
You received this message because you are subscribed to the Google Groups "ggplot2" group.
To unsubscribe from this group and stop receiving emails from it, send an email to ggplot2+u...@googlegroups.com.
For more options, visit https://groups.google.com/groups/opt_out.
Thomas Hopper
Feb 20, 2014, 10:34:24 AM2/20/14
to baptiste auguie, ggplot2
Reply all
Reply to author
Forward
0 new messages