matching geom_point size to the geom_tile size

Frans Slothouber
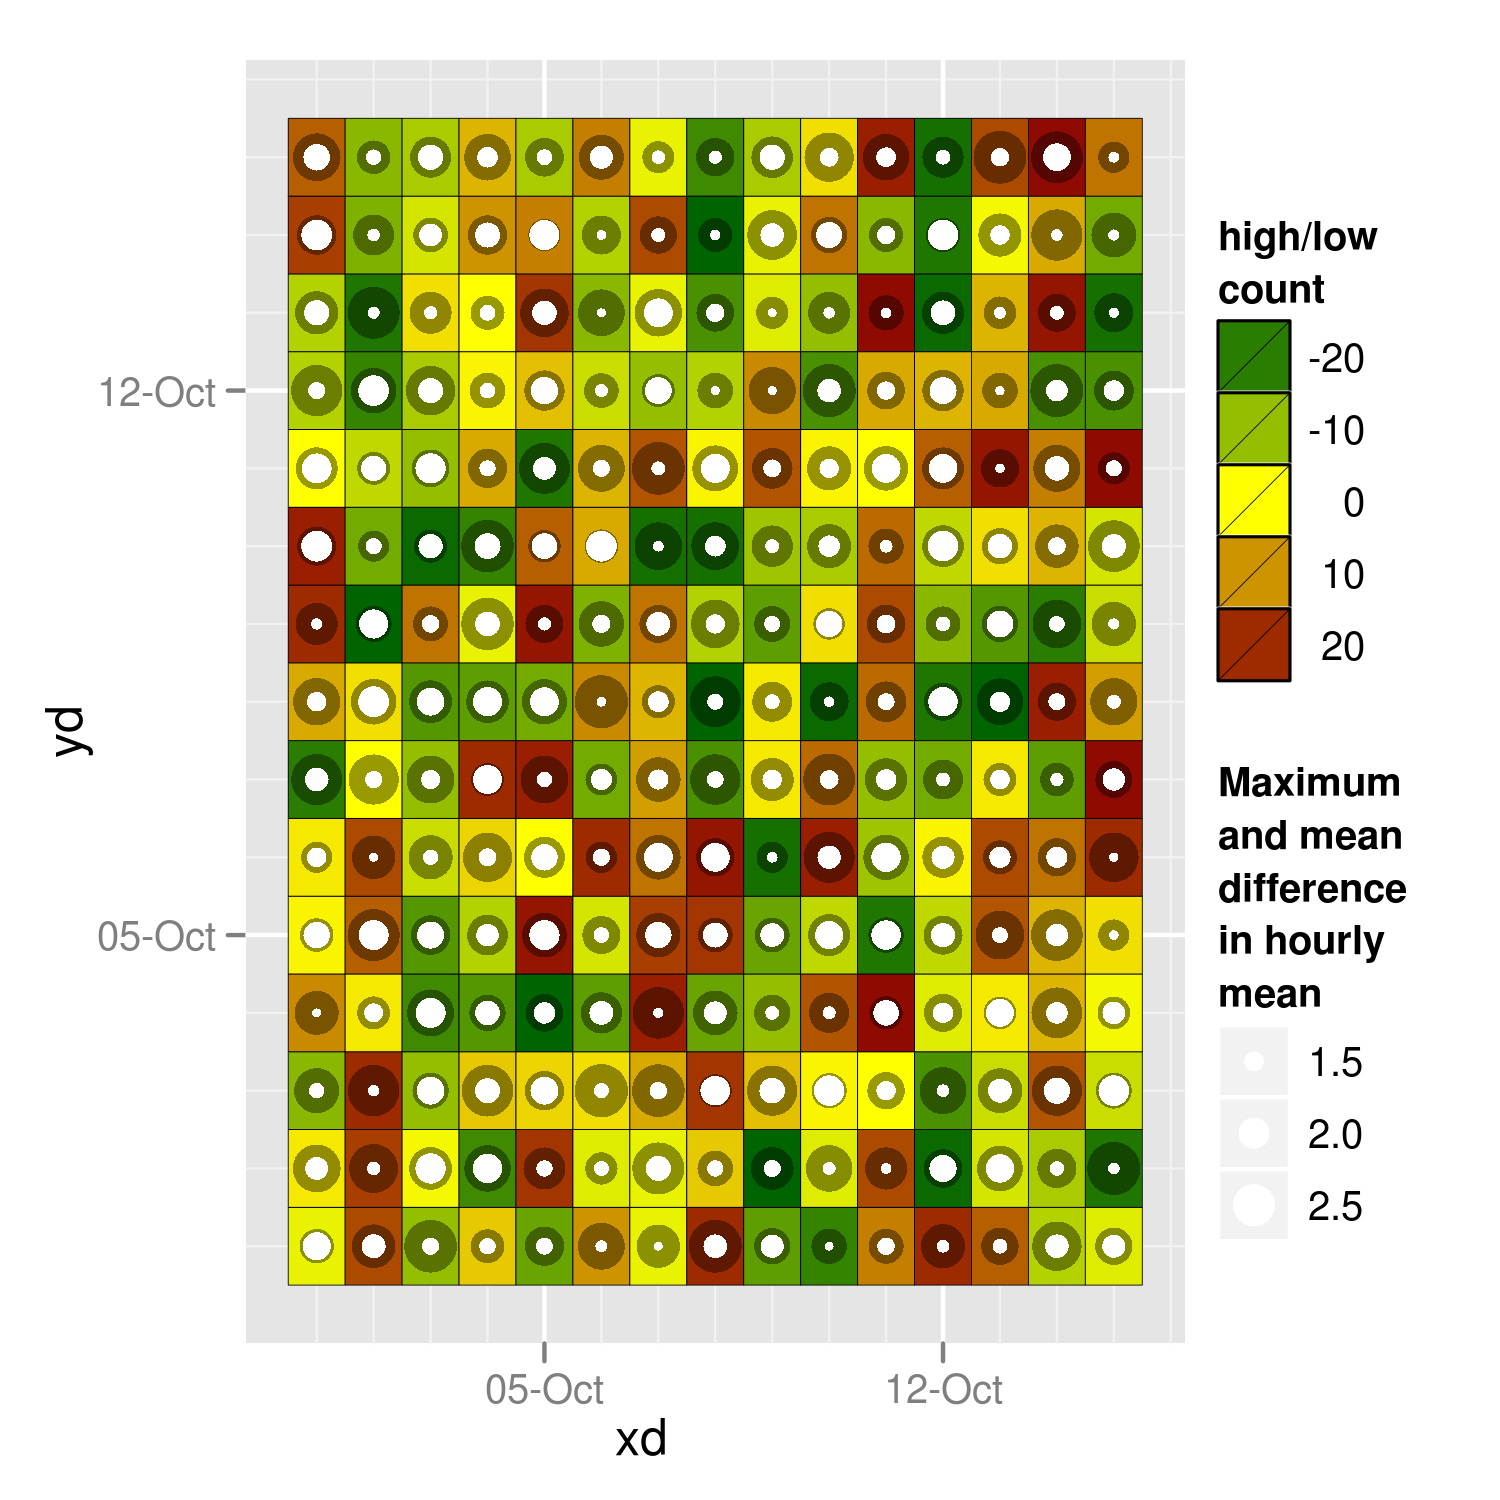
I'm trying to combine geom_tile with geom_point to show three aspects of
a comparison between days: ( count, mean, and max ).
The following code creates and example of this.
require(ggplot2)
d1 <- as.Date("2009-10-01")
d2 <- as.Date("2009-10-15")
xd <- rep( seq(d1,d2,by="day"), each=15 )
yd <- rep( seq(d1,d2,by="day"), 15 )
mm <- data.frame( xd=xd, yd=yd )
mm$mean <- runif( nrow(mm), min=1, max=2 )
mm$max <- runif( nrow(mm), min=2, max=3 )
mm$count <- floor( runif( nrow(mm), min=-24, max=24 ) )
p <- ggplot( mm, aes( x=xd, y=yd ) ) +
geom_tile( aes(fill=count ), colour="black", space="Lab" ) +
geom_point( aes( size=max ), alpha=0.4 ) +
geom_point( aes( size=mean ), colour="white" ) +
scale_fill_gradient2( limits=c( -24, 24 ),
name="high/low\ncount",
low="darkgreen",
mid="yellow",
high="darkred") +
scale_size( name="Maximum\nand mean\ndifference\nin hourly\nmean" )
ggsave( plot=p, "example.png", width=5, height=5 )
My problem is that this works well if I compare a set of 15 days,
that is the size of the points and the size of the tiles match.
However if my data set contains only a few days, the points look way too small,
and when I have many days, the points look too big compared to the tiles.
Is there a way to match the point size to the tile size?
I've attached an example of a the plot I like (example) and the one
with points that are too small (example1.png)
Have fun,
Frans.

Dennis Murphy
The 'obvious' solution would be to create a multiplier for the point sizes that would be proportional to the area of a tile, but I believe you run into certain limitations inside ggplot2 per se since the sizes rendered seem to be relative to the maximum size rather than the size itself. Compare the following:
dd <- data.frame(x = 1:5, y = 1:5, sz = (1:5)^2)
ggplot(dd, aes(x, y)) + geom_point(aes(size = sz))
# windows() # start up new graphics device of choice
dd <- data.frame(x = 1:5, y = 1:5, sz = 2 * (1:5))
ggplot(dd, aes(x, y)) + geom_point(aes(size = sz))
# Compare the max and min sizes of the two graphs
dev.off(dev.cur()) # Turn off most recently created device
The physical size of the largest point is the same in the two plots, but the ratio of (max/min)^2 seems to be maintained.
For five-day data (d2 <- as.Date('2009-10-05')), I tried computing a size multiplier parameter of
sz <- 225/(length(unique(xd))^2)
which one would hope would increase the physical point size by a factor of 9 relative to the 15-day plot, but it doesn't. I squared the result and tried again - the result was a not too dissimilar plot. The primary observation is that the maximum physical point size is the same in both plots. It's possible that it is hard-coded in ggplot2, which is suggested by the initial tests above. One possible way out may be to hack the code with the grid package, or wait for one of the experts to do it for you :) I haven't ventured into the grid jungle yet...
I tried it again for 20 days and 30 days, and although the points took up a larger proportion of the area than the 15 day plot, they looked OK to me, which suggests that, for the 'many-day' plots, some ratio of point size relative to tile size seems to work. [The above 'formula' for sz is a pure hack for testing the concept - it's not meant to be taken seriously.] As for the 'few day' plots, you have an absolute size problem to deal with, I believe, as noted above.
HTH,
Dennis
--
You received this message because you are subscribed to the ggplot2 mailing list.
Please provide a reproducible example: http://gist.github.com/270442
To post: email ggp...@googlegroups.com
To unsubscribe: email ggplot2+u...@googlegroups.com
More options: http://groups.google.com/group/ggplot2

Hadley Wickham
> that would be proportional to the area of a tile, but I believe you run into
> certain limitations inside ggplot2 per se since the sizes rendered seem to
> be relative to the maximum size rather than the size itself. Compare the
> following:
The basic problem is that tiles are sized in data coordinates, and
points are sized in absolute units. There's basically no way to unify
them (except to draw polygon circles in data space).
Hadley
--
Assistant Professor / Dobelman Family Junior Chair
Department of Statistics / Rice University
http://had.co.nz/

Kohske Takahashi
several weeks ago I wrote a geom-circle function for my own purpose,
but probably it is relevant to what you want.
here is an example code. maybe you can find your solution.
GeomCircle <- proto(Geom, {
default_stat <- function(.) StatIdentity
default_pos <- function(.) PositionIdentity
default_aes <- function(.) aes(colour=NA, fill="grey20", radius=0.5,
linetype=1, alpha = 1)
required_aes <- c("x", "y")
draw <- draw_groups <- function(., data, scales, coordinates, ...) {
data <- remove_missing(data, na.rm,
c("x", "y", "radius"), name = "geom_circle")
if (empty(data)) return(zeroGrob())
with(coordinates$transform(data, scales),
ggname(.$my_name(), circleGrob(x, y, r = radius, default.unit = "native",
gp=gpar(col=alpha(colour, alpha), fill = alpha(fill, alpha))))
)
}
objname <- "circle"
guide_geom <- function(.) "polygon"
})
geom_circle <- GeomCircle$build_accessor()
d1 <- as.Date("2009-10-01")
d2 <- as.Date("2009-10-15")
xd <- rep( seq(d1,d2,by="day"), each=15 )
yd <- rep( seq(d1,d2,by="day"), 15 )
mm <- data.frame( xd=xd, yd=yd )
mm$mean <- runif( nrow(mm), min=1, max=2 )
mm$max <- runif( nrow(mm), min=2, max=3 )
mm$count <- floor( runif( nrow(mm), min=-24, max=24 ) )
mm <- transform(mm, smean = mean/base::max(max), smax = max/base::max(max))
radius <- 1/2/max(length(unique(mm$xd)), length(unique(mm$yd)))
p <- ggplot( mm, aes( x=xd, y=yd ) ) +
geom_tile( aes(fill=count), colour="black", space="Lab" ) +
geom_circle(aes(radius=radius*smax), alpha=0.4) +
geom_circle(aes(radius=radius*smean), fill="white", colour="white") +
scale_fill_gradient2( limits=c( -24, 24 ),
name="high/low\ncount",
low="darkgreen",
mid="yellow",
high="darkred") +
scale_size( name="Maximum\nand mean\ndifference\nin hourly\nmean" )
mm2 <- subset(mm, xd < 14523 & yd < 14522)
radius <- 1/2/max(length(unique(mm2$xd)), length(unique(mm2$yd)))
p <- ggplot( mm2, aes( x=xd, y=yd ) ) +
geom_tile( aes(fill=count), colour="black", space="Lab" ) +
geom_circle(aes(radius=radius*smax), alpha=0.4) +
geom_circle(aes(radius=radius*smean), fill="white", colour="white") +
scale_fill_gradient2( limits=c( -24, 24 ),
name="high/low\ncount",
low="darkgreen",
mid="yellow",
high="darkred") +
scale_size( name="Maximum\nand mean\ndifference\nin hourly\nmean" )
--
Kohske Takahashi <takahash...@gmail.com>
Research Center for Advanced Science and Technology,
The University of Tokyo, Japan.
http://www.fennel.rcast.u-tokyo.ac.jp/profilee_ktakahashi.html