Cumulative sum of grouped data
274 views
Skip to first unread message

RiF
Aug 11, 2021, 10:30:46 AM8/11/21
to ggplot2
I am processing user/hours/date data to present the cumulative total of hours across a range of dates. Typical data is:
library(data.table)
library(ggplot2)
DT = data.table(
user = c("user1", "user2", "user1", "user2", "user3"),
day = c(
as.Date("2000-01-01"),
as.Date("2000-01-01"),
as.Date("2000-01-02"),
as.Date("2000-01-02"),
as.Date("2000-01-03")
),
hours = c(2.5, 3, 4.5, 2, 3)
)
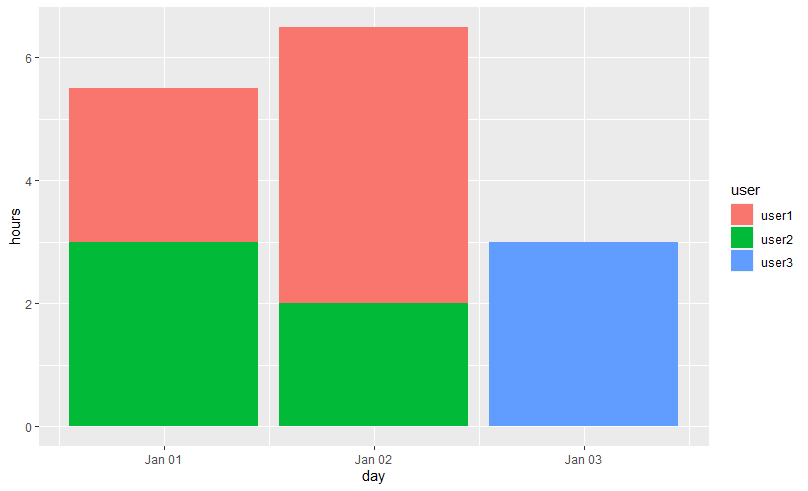
p <-
ggplot(DT, aes(x = day, y = hours, fill = user)) + geom_bar(stat = "identity")
which produces a bar chart like
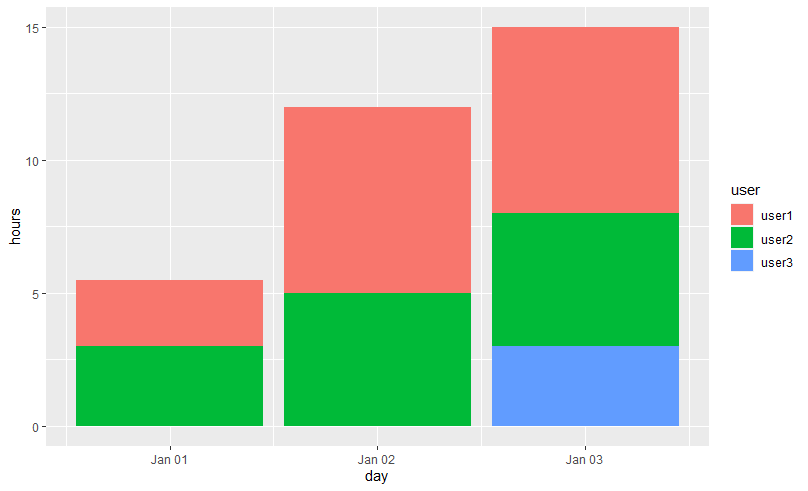
I wish to present the cumulative sums as
1. Each user does not record hours every day - in this case user3 is the only user who works on Jan 03.
2. Need to allow for days (Saturday and Sunday) when no user records any hours.
3. The maximum date range shall be taken from the data set in the initial data.
1. Can the cumulative presentation be achieved with just ggplot2?
or
2. Does the data have to be manipulated (inserting zero values for example), to ensure every day has 0 or more hours entered for every user?
Thanks in advance

Robert Winkelman
Oct 24, 2022, 11:46:08 AM10/24/22
to ggplot2
## add this
#### get all possible combinations of user and day
DT_temp <- expand.grid(user = unique(DT$user), day = unique(DT$day))
DT_temp$hours <- 0
DT2 <- rbind(DT, DT_temp)
### roll up and sort dataframe
DT2 <- DT2[order(DT2$user , DT2$day), ] %>% group_by(user, day) %>% summarise(hours=sum(hours))
### cumulative sum
DT2 <- DT2 %>% group_by(user) %>% mutate(cum_hours=cumsum(hours))
p2 <- ggplot(DT2, aes(x = day, y = cum_hours, fill = user)) + geom_bar(stat = "identity")
p2
Reply all
Reply to author
Forward
0 new messages