facet borders
3,139 views
Skip to first unread message

Tom W
Oct 15, 2013, 5:19:15 PM10/15/13
to ggp...@googlegroups.com
It's easy to remove features of a plot:
library(ggplot2)
d1 <- data.frame(y = runif(100),
x = runif(100),
g = rep(LETTERS[1:4], 25))
p1 <- ggplot(d1) +
geom_point(aes(x, y)) +
facet_wrap(~ g, ncol = 2) +
theme(strip.background = element_blank(),
axis.ticks = element_blank(),
axis.line = element_blank(),
panel.grid.major = element_line(colour="white"),
panel.grid.minor = element_line(colour="white"),
panel.background = element_blank(),
legend.position = "none")
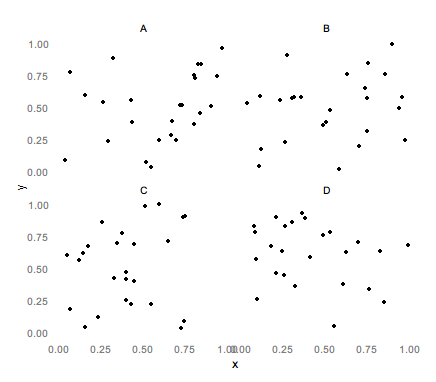
But I've lost the apparent relationship between each facet's labels and plotting area. I'd like a set of borders to surround the plotting area and the facet label, like so:

Is this easy or I do have to write grid code?

Ista Zahn
Oct 15, 2013, 6:53:54 PM10/15/13
to Tom W, ggplot2
Hi Tom,
I don't think it's easy to get it exactly like that. The relevant
theme elements are panel.border / panel.backround and
strip.background. You can do
ggplot(d1) +
geom_point(aes(x, y)) +
facet_wrap(~ g, ncol = 2) +
theme_minimal() +
theme(panel.border = element_rect(color="black", fill=NA)))
or
ggplot(d1) +
geom_point(aes(x, y)) +
facet_wrap(~ g, ncol = 2) +
theme_minimal() +
theme(panel.border = element_rect(color="black", fill=NA),
strip.background = element_rect(fill=NA, color="black"))
both of which come close but are not exactly what you asked for. My
guess is that some "manual" tweaking will be needed to get the grid
going around the plot area and the facet label.
Best,
Ista
On Tue, Oct 15, 2013 at 5:19 PM, Tom W <thoma...@gmail.com> wrote:
> It's easy to remove features of a plot:
>
> library(ggplot2)
> d1 <- data.frame(y = runif(100),
> x = runif(100),
> g = rep(LETTERS[1:4], 25))
>
> p1 <- ggplot(d1) +
> geom_point(aes(x, y)) +
> facet_wrap(~ g, ncol = 2) +
> theme(strip.background = element_blank(),
> axis.ticks = element_blank(),
> axis.line = element_blank(),
> panel.grid.major = element_line(colour="white"),
> panel.grid.minor = element_line(colour="white"),
> panel.background = element_blank(),
> legend.position = "none")
>
>
> --
> You received this message because you are subscribed to the ggplot2 mailing
> list.
> Please provide a reproducible example:
> https://github.com/hadley/devtools/wiki/Reproducibility
>
> To post: email ggp...@googlegroups.com
> To unsubscribe: email ggplot2+u...@googlegroups.com
> More options: http://groups.google.com/group/ggplot2
>
> ---
> You received this message because you are subscribed to the Google Groups
> "ggplot2" group.
> To unsubscribe from this group and stop receiving emails from it, send an
> email to ggplot2+u...@googlegroups.com.
> For more options, visit https://groups.google.com/groups/opt_out.
I don't think it's easy to get it exactly like that. The relevant
theme elements are panel.border / panel.backround and
strip.background. You can do
ggplot(d1) +
geom_point(aes(x, y)) +
facet_wrap(~ g, ncol = 2) +
theme(panel.border = element_rect(color="black", fill=NA)))
or
ggplot(d1) +
geom_point(aes(x, y)) +
facet_wrap(~ g, ncol = 2) +
theme(panel.border = element_rect(color="black", fill=NA),
strip.background = element_rect(fill=NA, color="black"))
both of which come close but are not exactly what you asked for. My
guess is that some "manual" tweaking will be needed to get the grid
going around the plot area and the facet label.
Best,
Ista
On Tue, Oct 15, 2013 at 5:19 PM, Tom W <thoma...@gmail.com> wrote:
> It's easy to remove features of a plot:
>
> library(ggplot2)
> d1 <- data.frame(y = runif(100),
> x = runif(100),
> g = rep(LETTERS[1:4], 25))
>
> p1 <- ggplot(d1) +
> geom_point(aes(x, y)) +
> facet_wrap(~ g, ncol = 2) +
> theme(strip.background = element_blank(),
> axis.ticks = element_blank(),
> axis.line = element_blank(),
> panel.grid.major = element_line(colour="white"),
> panel.grid.minor = element_line(colour="white"),
> panel.background = element_blank(),
> legend.position = "none")
>
>
> But I've lost the apparent relationship between each facet's labels and
> plotting area. I'd like a set of borders to surround the plotting area and
> the facet label, like so:
>
> plotting area. I'd like a set of borders to surround the plotting area and
> the facet label, like so:
>
> Is this easy or I do have to write grid code?
>
> --
>
> --
> You received this message because you are subscribed to the ggplot2 mailing
> list.
> Please provide a reproducible example:
> https://github.com/hadley/devtools/wiki/Reproducibility
>
> To post: email ggp...@googlegroups.com
> To unsubscribe: email ggplot2+u...@googlegroups.com
> More options: http://groups.google.com/group/ggplot2
>
> ---
> You received this message because you are subscribed to the Google Groups
> "ggplot2" group.
> To unsubscribe from this group and stop receiving emails from it, send an
> email to ggplot2+u...@googlegroups.com.
> For more options, visit https://groups.google.com/groups/opt_out.

baptiste auguie
Oct 15, 2013, 7:03:05 PM10/15/13
to Ista Zahn, Tom W, ggplot2
You can easily add things with gtable,
g = ggplotGrob(p1)
gtable_add_grobs = gtable:: gtable_add_grob
g = gtable_add_grobs(g, replicate(4, grid::rectGrob(), simplify=FALSE), t=c(3,3,7,7), l=c(4,7,4,7), b=c(4,4,8,8))
grid.newpage()
grid.draw(g)
the indices could be found automatically by looking at g$layout.
HTH,
b.
Reply all
Reply to author
Forward
0 new messages