coord_map()
48 views
Skip to first unread message

Vikas Rawal
Feb 20, 2015, 6:25:09 AM2/20/15
to ggp...@googlegroups.com
I am trying to create a map using ggplot2 but am having trouble with projections.
The following code (taken from http://docs.ggplot2.org/current/coord_map.html) shows what is going wrong:
world <- map_data("world")
worldmap <- ggplot(world, aes(x=long, y=lat, group=group)) +
geom_path() +
scale_y_continuous(breaks=(-2:2) * 30) +
scale_x_continuous(breaks=(-4:4) * 45)
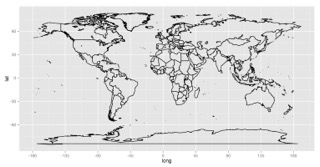
##The following like produces attached Figure 1
worldmap
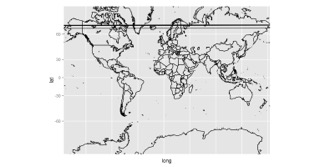
##The following like produces attached Figure 2
worldmap+ coord_map()
When I use projections, strange horizontal lines appear. Why is that? I am having similar trouble with a set of chloropleth maps that I am trying to make. With chloropleth maps, I get horizontal bands of colour.
Would be grateful if somebody could point out what am I doing wrong.
Vikas

David Reichel
Feb 21, 2015, 2:08:24 PM2/21/15
to ggp...@googlegroups.com, vikas...@agrarianresearch.org
Hi,
You could try to add limits to the coord_map function. See last line:
You could try to add limits to the coord_map function. See last line:
world <- map_data("world")
worldmap <- ggplot(world, aes(x=long, y=lat, group=group)) +
geom_path() +
scale_y_continuous(breaks=(-2:2) * 30) +
scale_x_continuous(breaks=(-4:4) * 45) +
coord_map(xlim=c(-180,180))
Best,
David
coord_map(xlim=c(-180,180))
Best,
David
--
--
You received this message because you are subscribed to the ggplot2 mailing list.
Please provide a reproducible example: https://github.com/hadley/devtools/wiki/Reproducibility
To post: email ggp...@googlegroups.com
To unsubscribe: email ggplot2+u...@googlegroups.com
More options: http://groups.google.com/group/ggplot2
---
You received this message because you are subscribed to the Google Groups "ggplot2" group.
To unsubscribe from this group and stop receiving emails from it, send an email to ggplot2+u...@googlegroups.com.
For more options, visit https://groups.google.com/d/optout.

Raza Khan
Feb 23, 2015, 6:08:49 AM2/23/15
to David Reichel, ggp...@googlegroups.com, vikas...@agrarianresearch.org
Dear all
I wish to work on maps, maptools etc in R. though i has already downloaded it. could any body tell which version of R could run it and also the map sites/library to download.Reply all
Reply to author
Forward
0 new messages