scatter plot of 4 series of different sizes with symbol and color
42 views
Skip to first unread message

comachi
May 13, 2021, 8:24:46 PM5/13/21
to ggplot2
Hello
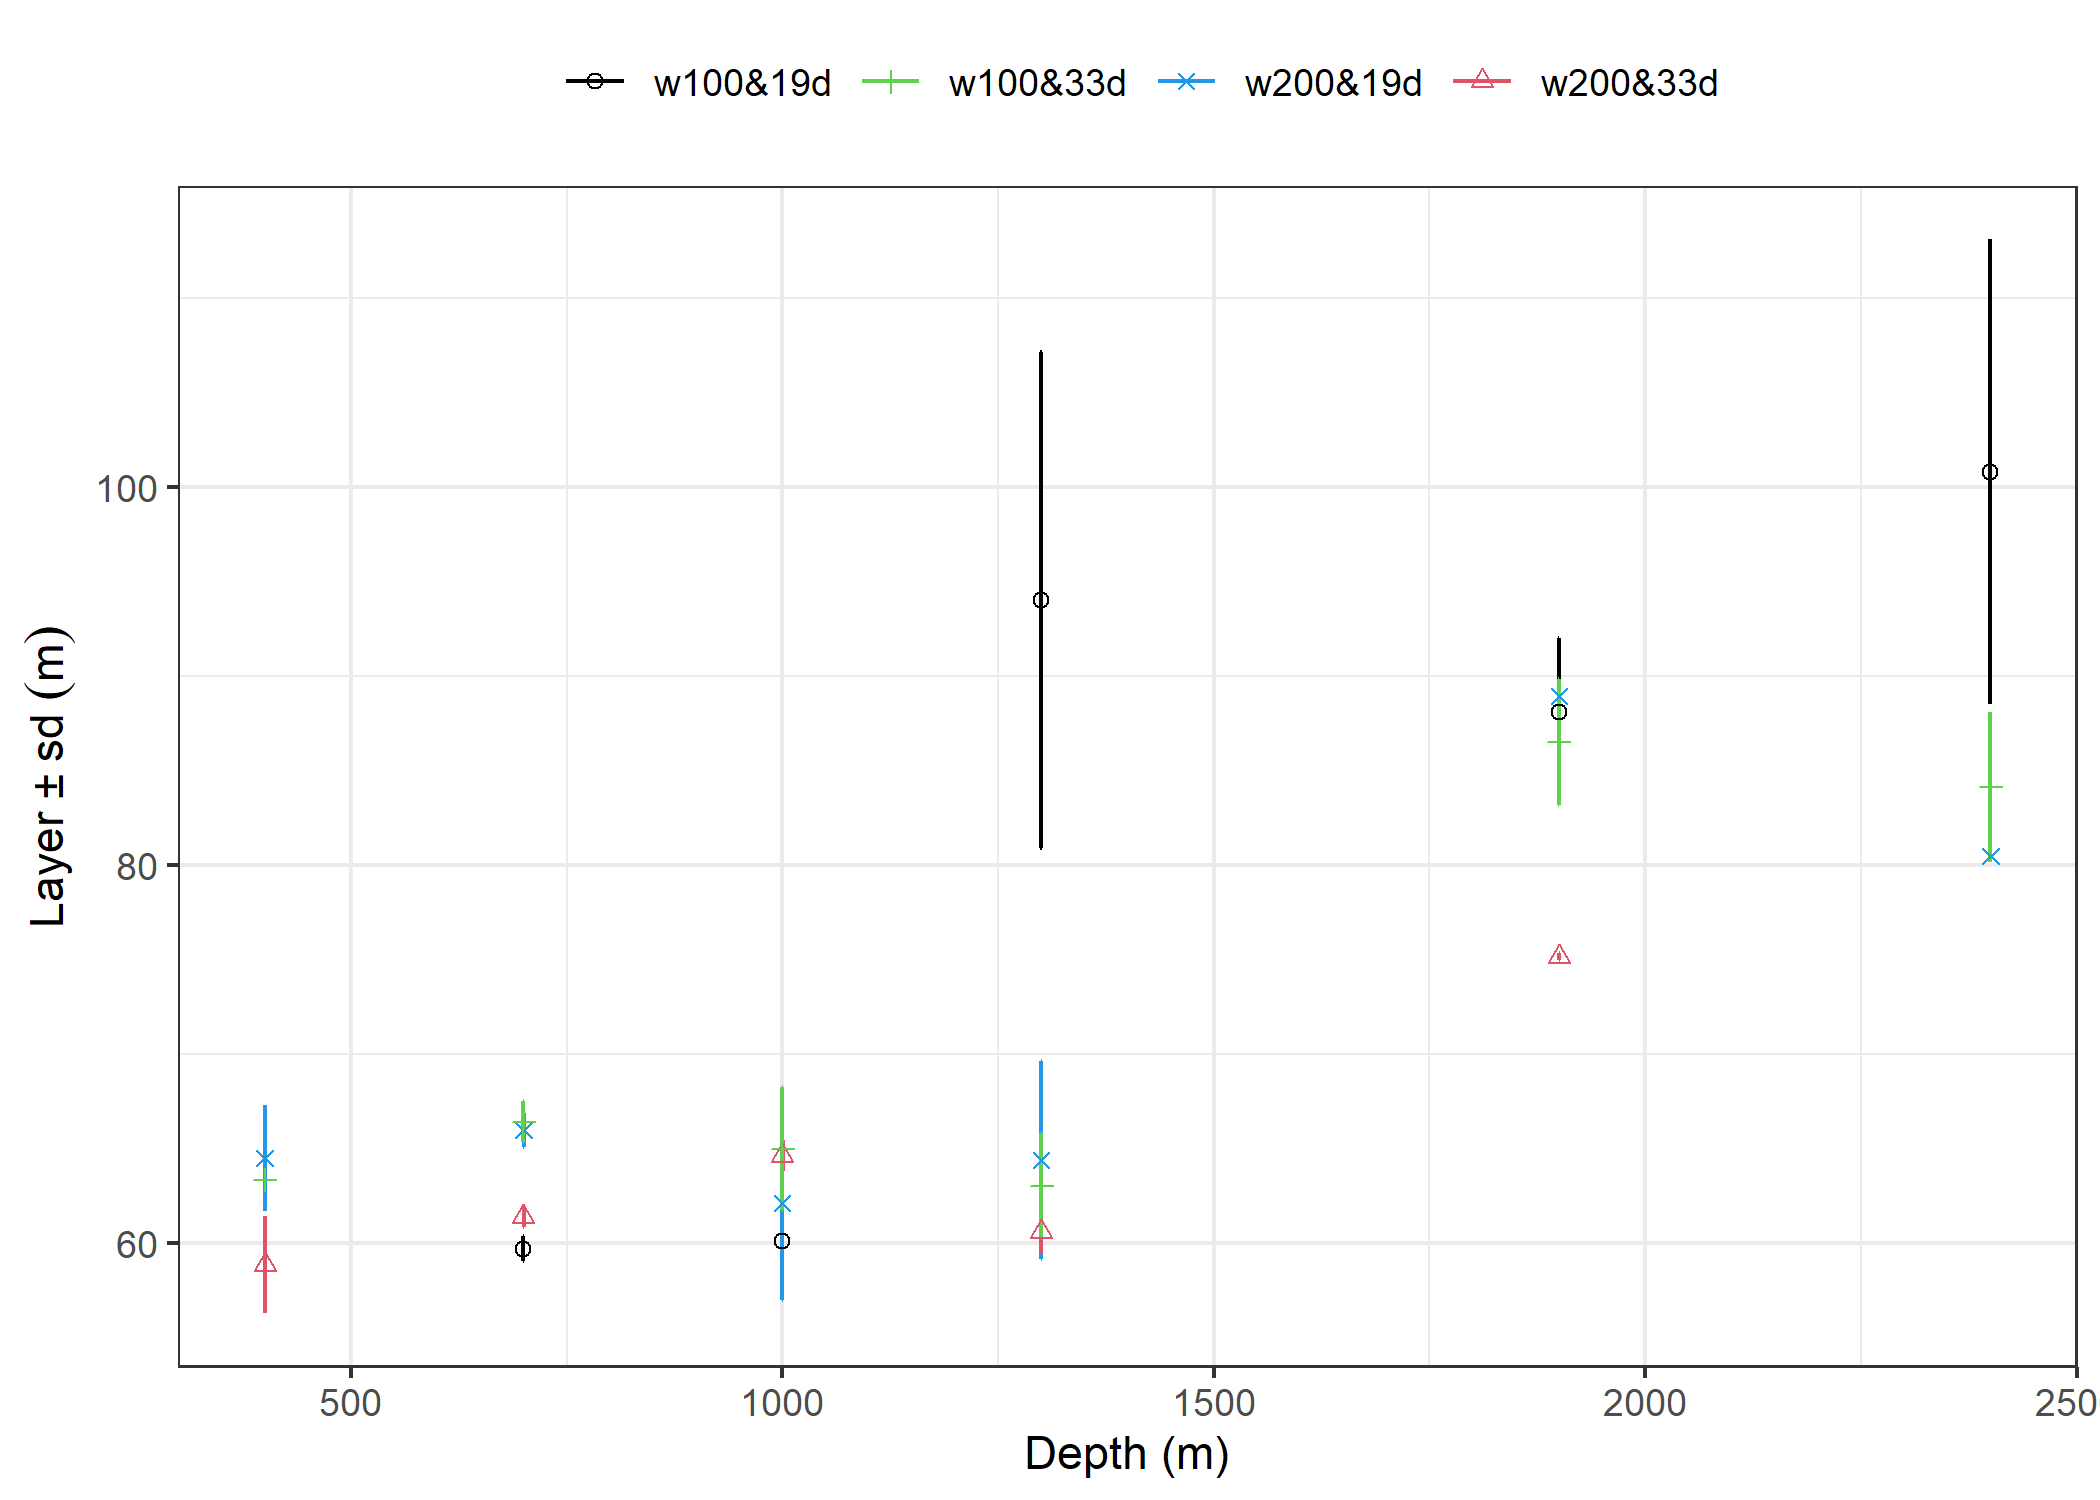
I'm trying to make a scatter plot (depth x layer thickness) with four series (two speeds x two initial dates) labeled as gr in the data (g.dados) with respective symbols and colors as factors. I also want to plot error bars of standard deviation. Because of missing values (already excluded) some series have 6 data and others 5.
I want to set:
1. Colors from g.dados$col;
2. Shapes from g.dados$sym;
3. Match the legend as in g.dados$gr.
My code is on the end.
I have tried and got this kind of picture (below). However:
1. The symbols plot do not match the numbers in g.dados$sym;
2. The colors do not match those set in g.dados$col;
3. Although there is no data at 80 m layer and 2400 m depth in w200&19d (cyan x). This cyan x data at layer 80 and depth 2400 should be red triangle
actually.
4. Since the symbols nor colors match what I was expecting, I do not know what´s going on.
Any help is very much appreciated.
Claudia
4. Since the symbols nor colors match what I was expecting, I do not know what´s going on.
Any help is very much appreciated.
Claudia
=========================
library(ggplot2)
#> Warning: package 'ggplot2' was built under R version 4.0.5
g.dados <-(
structure(list(z = c(700, 1000, 1300, 1900, 2400, 400, 700, 1000,
1300, 1900, 2400, 400, 700, 1000, 1300, 1900, 400, 700, 1000,
1300, 1900, 2400), av = c(59.674109307, 60.0898419565217, 93.9882922777395,
88.0961686694561, 100.789614793772, 64.4807567404372, 65.9671338519961,
62.1091478009619, 64.3812664839562, 88.9143754288321, 80.4691082221116,
58.829247331, 61.3875288887776, 64.601354382, 60.565148709, 75.147740498,
63.31603782, 66.404200136, 64.9784694665427, 63.0067183027744,
86.4782565384615, 84.105146722597), sd = c(0.653310688119983,
1.78752173759148, 13.1180439835745, 3.88841197818639, 12.2998937979002,
2.81448054205284, 0.888246693277689, 5.15922094435584, 5.22316861373973,
0.596914910101061, 2.67904922880763, 2.55523456996104, 0.53868130724664,
0.819825697844692, 1.11896332002883, 0.166655174640186, 0.442452033744066,
1.10231495886519, 3.27717380738803, 2.78185066045157, 3.31948908645766,
3.95260470707916), gr = structure(c(1L, 1L, 1L, 1L, 1L, 2L, 2L,
2L, 2L, 2L, 2L, 3L, 3L, 3L, 3L, 3L, 4L, 4L, 4L, 4L, 4L, 4L), .Label = c("w100&19d",
"w100&33d", "w200&19d", "w200&33d"), class = "factor"), sym = structure(c(1L,
1L, 1L, 1L, 1L, 3L, 3L, 3L, 3L, 3L, 3L, 4L, 4L, 4L, 4L, 4L, 2L,
2L, 2L, 2L, 2L, 2L), .Label = c("1", "15", "2", "4"), class = "factor"),
col = structure(c(1L, 1L, 1L, 1L, 1L, 2L, 2L, 2L, 2L, 2L,
2L, 3L, 3L, 3L, 3L, 3L, 4L, 4L, 4L, 4L, 4L, 4L), .Label = c("blue",
"chartreuse4", "cyan3", "red"), class = "factor")), row.names = c(NA,
-22L), class = c("tbl_df", "tbl", "data.frame"))
)
y.lim<-c(56.27401, 113.08951)
my.Graph <- ggplot(g.dados, aes(z, av,group=sym,shape=sym,colour=sym)) +
geom_errorbar(aes(ymin=av-sd,
ymax=av+sd,colour=sym),
width=5, position=position_dodge(0.65))+
geom_point()+
theme(plot.title = element_text(margin = margin())
,legend.position = "top")+
xlab("Depth (m)") +
ylab(expression("Layer ±"~sd~(m))) +
scale_colour_manual(
name = "",values=unique(g.dados$sym),labels=unique(g.dados$gr)
) +
scale_shape_manual(
name= "", values=unique(g.dados$sym),labels=unique(g.dados$gr)
) +
lims(x=c(400,2400),y=y.lim)
comachi
May 14, 2021, 1:50:01 PM5/14/21
to ggplot2
Hi, everyone! Playing a lot and searching on the internet I managed to pick my mistake!
The main mistake:
g.dados$col must be numbers and not characters.
The main mistake:
g.dados$col must be numbers and not characters.
Then, I also set the colors and shapes that I wanted to be used in the beginning as vcol and vsym; and these were set in scale_color_manual and scale_shape_manual in ggplot. The corrected code is below.
Many thanks!
Many thanks!
Claudia
library(ggplot2)
#> Warning: package 'ggplot2' was built under R version 4.0.5
#> Warning: package 'ggplot2' was built under R version 4.0.5
g.dados <-( structure(list(depth = c(700, 1000, 1300, 1900, 2400, 400, 700, 1000, 1300, 1900, 2400, 400, 700, 1000, 1300, 1900, 400, 700, 1000, 1300, 1900, 2400), av = c(59.674109307, 60.0898419565217, 93.9882922777395, 88.0961686694561, 100.789614793772, 64.4807567404372, 65.9671338519961, 62.1091478009619, 64.3812664839562, 88.9143754288321, 80.4691082221116, 58.829247331, 61.3875288887776, 64.601354382, 60.565148709, 75.147740498, 63.31603782, 66.404200136, 64.9784694665427, 63.0067183027744, 86.4782565384615, 84.105146722597), sd = c(0.653310688119983, 1.78752173759148, 13.1180439835745, 3.88841197818639, 12.2998937979002, 2.81448054205284, 0.888246693277689, 5.15922094435584, 5.22316861373973, 0.596914910101061, 2.67904922880763, 2.55523456996104, 0.53868130724664, 0.819825697844692, 1.11896332002883, 0.166655174640186, 0.442452033744066, 1.10231495886519, 3.27717380738803, 2.78185066045157, 3.31948908645766, 3.95260470707916), gr = structure(c(1L, 1L, 1L, 1L, 1L, 2L, 2L, 2L, 2L, 2L, 2L, 3L, 3L, 3L, 3L, 3L, 4L, 4L, 4L, 4L, 4L, 4L), .Label = c("w100&19d", "w100&33d", "w200&19d", "w200&33d"), class = "factor"), sym = structure(c(1L, 1L, 1L, 1L, 1L, 2L, 2L, 2L, 2L, 2L, 2L, 3L, 3L, 3L, 3L, 3L, 4L, 4L, 4L, 4L, 4L, 4L), .Label = c("0", "1", "2", "4"), class = "factor"), col = structure(c(1L, 1L, 1L, 1L, 1L, 2L, 2L, 2L, 2L, 2L, 2L, 3L, 3L, 3L, 3L, 3L, 4L, 4L, 4L, 4L, 4L, 4L), .Label = c("blue", "chartreuse4", "cyan3", "red"), class = "factor")), row.names = c(NA, -22L), class = c("tbl_df", "tbl", "data.frame")) )
vcol <- c("blue","chartreuse4","cyan3","red")
vsym <- c(0,1,2,4)
y.lim<-c(56.27401, 113.08951)
my.Graph <- ggplot(g.dados, aes(depth, av)) +
geom_point(aes(shape = gr, color = gr), size = 2) +
geom_errorbar(aes(ymin = av-sd, ymax = av+sd, color=gr), width = 20)+
scale_shape_manual("",values = vsym) +
scale_color_manual("",values = vcol)+
labs(y=expression(Layer~"±"~sd~(m)), x ="Depth (m)") +
theme(legend.position = "top")
print(my.Graph)
Created on 2021-05-14 by the reprex package (v2.0.0)
Reply all
Reply to author
Forward
0 new messages