gradient color scale for ordered factor
1,785 views
Skip to first unread message

Alexander Shenkin
May 14, 2012, 12:34:11 PM5/14/12
to ggp...@googlegroups.com
Hi Folks,
I'm trying to put together a graph that groups on an ordered factor, and apply a gradient color scheme. scale_color_brewer() works, but it starts the scale with white, which is hard to see. I'd like to start with a more visible tone, and go darker from there. Any suggestions?
Thanks,
Allie
> grp = floor(seq(100, 104.9, length.out=25))
> mydf = data.frame(x=1:5, y=runif(25)+grp, grp=ordered(grp))
> ggplot(data=mydf, aes(x=x, y=y, color=grp)) + geom_line() + scale_color_brewer()
> ggplot(data=mydf, aes(x=x, y=y, color=grp)) + geom_line() + scale_color_gradient()
Error: Discrete value supplied to continuous scale

Ista Zahn
May 14, 2012, 1:00:28 PM5/14/12
to Alexander Shenkin, ggp...@googlegroups.com
Hi Allie,
Here are a few things you can try.
1) use a different colorbrewer pallet, e.g.,
scale_color_brewer(palette="YlGnBu") -- see http://colorbrewer2.org/
for available palletes
2) use scale_color_discrete with appropriate h interval (see
?scale_color_discrete for details)
3) use scale_color_manual to choose the colors explicitly
Best,
Ista
> You received this message because you are subscribed to the ggplot2 mailing list.
> Please provide a reproducible example: https://github.com/hadley/devtools/wiki/Reproducibility
>
> To post: email ggp...@googlegroups.com
> To unsubscribe: email ggplot2+u...@googlegroups.com
> More options: http://groups.google.com/group/ggplot2
Here are a few things you can try.
1) use a different colorbrewer pallet, e.g.,
scale_color_brewer(palette="YlGnBu") -- see http://colorbrewer2.org/
for available palletes
2) use scale_color_discrete with appropriate h interval (see
?scale_color_discrete for details)
3) use scale_color_manual to choose the colors explicitly
Best,
Ista
On Mon, May 14, 2012 at 12:34 PM, Alexander Shenkin <ashe...@ufl.edu> wrote:
>
> Hi Folks,
>
> I'm trying to put together a graph that groups on an ordered factor, and apply a gradient color scheme. scale_color_brewer() works, but it starts the scale with white, which is hard to see. I'd like to start with a more visible tone, and go darker from there. Any suggestions?
>
> Thanks,
> Allie
>
> > grp = floor(seq(100, 104.9, length.out=25))
> > mydf = data.frame(x=1:5, y=runif(25)+grp, grp=ordered(grp))
> > ggplot(data=mydf, aes(x=x, y=y, color=grp)) + geom_line() + scale_color_brewer()
>
>
>
>
> Hi Folks,
>
> I'm trying to put together a graph that groups on an ordered factor, and apply a gradient color scheme. scale_color_brewer() works, but it starts the scale with white, which is hard to see. I'd like to start with a more visible tone, and go darker from there. Any suggestions?
>
> Thanks,
> Allie
>
> > grp = floor(seq(100, 104.9, length.out=25))
> > mydf = data.frame(x=1:5, y=runif(25)+grp, grp=ordered(grp))
> > ggplot(data=mydf, aes(x=x, y=y, color=grp)) + geom_line() + scale_color_brewer()
>
>
>
> > ggplot(data=mydf, aes(x=x, y=y, color=grp)) + geom_line() + scale_color_gradient()
> Error: Discrete value supplied to continuous scale
>
> --
> Error: Discrete value supplied to continuous scale
>
> You received this message because you are subscribed to the ggplot2 mailing list.
> Please provide a reproducible example: https://github.com/hadley/devtools/wiki/Reproducibility
>
> To post: email ggp...@googlegroups.com
> To unsubscribe: email ggplot2+u...@googlegroups.com
> More options: http://groups.google.com/group/ggplot2
Alexander Shenkin
May 14, 2012, 1:53:30 PM5/14/12
to Ista Zahn, ggp...@googlegroups.com
Thanks Ista,
colorbrewer2.org seems to start all it's sequential palettes with a very light color, almost white. I suppose I could use it to generate a longer list of hex values, truncate the lower portion of those, and use a manual scale with the remaining hex values. Kind of a pain when you're generating graphs that vary in the number of factors.
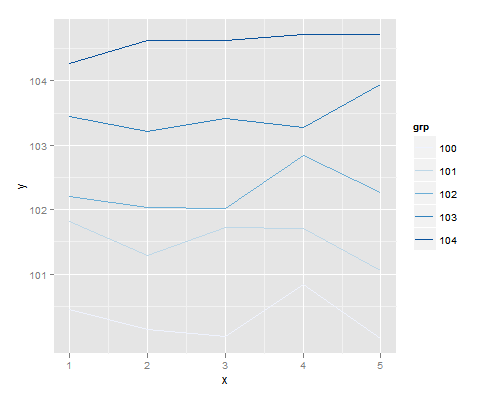
Here's what I've ended up with, for posterity. Happy to hear if anyone has methods that look better.
ggplot(data=mydf, aes(x=x, y=y, color=grp)) + geom_line() + scale_colour_discrete(h=c(170,230), l=seq(0,80,length.out=5))

Thanks,
Allie
colorbrewer2.org seems to start all it's sequential palettes with a very light color, almost white. I suppose I could use it to generate a longer list of hex values, truncate the lower portion of those, and use a manual scale with the remaining hex values. Kind of a pain when you're generating graphs that vary in the number of factors.
Here's what I've ended up with, for posterity. Happy to hear if anyone has methods that look better.
ggplot(data=mydf, aes(x=x, y=y, color=grp)) + geom_line() + scale_colour_discrete(h=c(170,230), l=seq(0,80,length.out=5))
Thanks,
Allie
Reply all
Reply to author
Forward
0 new messages