Change horizontal spacing between legend symbols and legend text
9,086 views
Skip to first unread message

Martin
Aug 20, 2013, 3:41:38 AM8/20/13
to ggp...@googlegroups.com
Hi there,
does anyone know how to change the horizontal distance between legend symbol and legend text in ggoplot2?
I tried the 'label.hjust' argument in guide_legend() but that only controls justification (values other than 0, 0.5, and 1 produce funny legend text positions).
The legend function in base graphics provides the 'x.intersp' argument to control the distance between legend symbol and text.
Thanks!
Martin

Brandon Hurr
Aug 20, 2013, 7:39:08 AM8/20/13
to Martin, ggp...@googlegroups.com
Try values between -1 and 0 too.
--
--
You received this message because you are subscribed to the ggplot2 mailing list.
Please provide a reproducible example: https://github.com/hadley/devtools/wiki/Reproducibility
To post: email ggp...@googlegroups.com
To unsubscribe: email ggplot2+u...@googlegroups.com
More options: http://groups.google.com/group/ggplot2
---
You received this message because you are subscribed to the Google Groups "ggplot2" group.
To unsubscribe from this group and stop receiving emails from it, send an email to ggplot2+u...@googlegroups.com.
For more options, visit https://groups.google.com/groups/opt_out.
Martin
Aug 20, 2013, 10:42:09 PM8/20/13
to ggp...@googlegroups.com, Martin
Yep, tried that as well...results in different horizontal positions for each legend entry. Worst case scenario is to suppress the legend text and use grid.text to get in the desired location.
On Tuesday, August 20, 2013 11:39:08 PM UTC+12, Brandon Hurr wrote:
Try values between -1 and 0 too.
On Tuesday, August 20, 2013, Martin wrote:
Hi there,--does anyone know how to change the horizontal distance between legend symbol and legend text in ggoplot2?I tried the 'label.hjust' argument in guide_legend() but that only controls justification (values other than 0, 0.5, and 1 produce funny legend text positions).The legend function in base graphics provides the 'x.intersp' argument to control the distance between legend symbol and text.Thanks!Martin
--
You received this message because you are subscribed to the ggplot2 mailing list.
Please provide a reproducible example: https://github.com/hadley/devtools/wiki/Reproducibility
To post: email ggp...@googlegroups.com
To unsubscribe: email ggplot2+unsubscribe@googlegroups.com
More options: http://groups.google.com/group/ggplot2
---
You received this message because you are subscribed to the Google Groups "ggplot2" group.
To unsubscribe from this group and stop receiving emails from it, send an email to ggplot2+unsubscribe@googlegroups.com.
Brandon Hurr
Aug 21, 2013, 3:34:30 AM8/21/13
to Martin, ggplot2
Well... I see what you mean. I looked it up in Winston's book and it's not covered. According to ?guide_legend(), label.hjust is the way to do it. When I tried to do it, I could get it to work... sort of. :/
p+scale_fill_discrete(guide = guide_legend(label.hjust=-5))
I'm never really sure when the scale is -1 to 1 or if you need to go higher/lower in order to get an effect. In this case -1 to 1 appeared to do very little, which would mean this would be hard to automate without knowing what controls is. Also, it only seems to affect the first element of the scale, not the entire scale. I tried to feed it a vector of adjustments c(-5,1,10) and the plot came out blank.
Might be a bug? Can you verify that you get the same thing?
B
To unsubscribe: email ggplot2+u...@googlegroups.com
More options: http://groups.google.com/group/ggplot2
---
You received this message because you are subscribed to the Google Groups "ggplot2" group.
To unsubscribe from this group and stop receiving emails from it, send an email to ggplot2+u...@googlegroups.com.

Dennis Murphy
Aug 21, 2013, 6:22:29 AM8/21/13
to Brandon Hurr, Martin, ggplot2
You get a similar effect using the legend.text.align theme element. Compare the following:
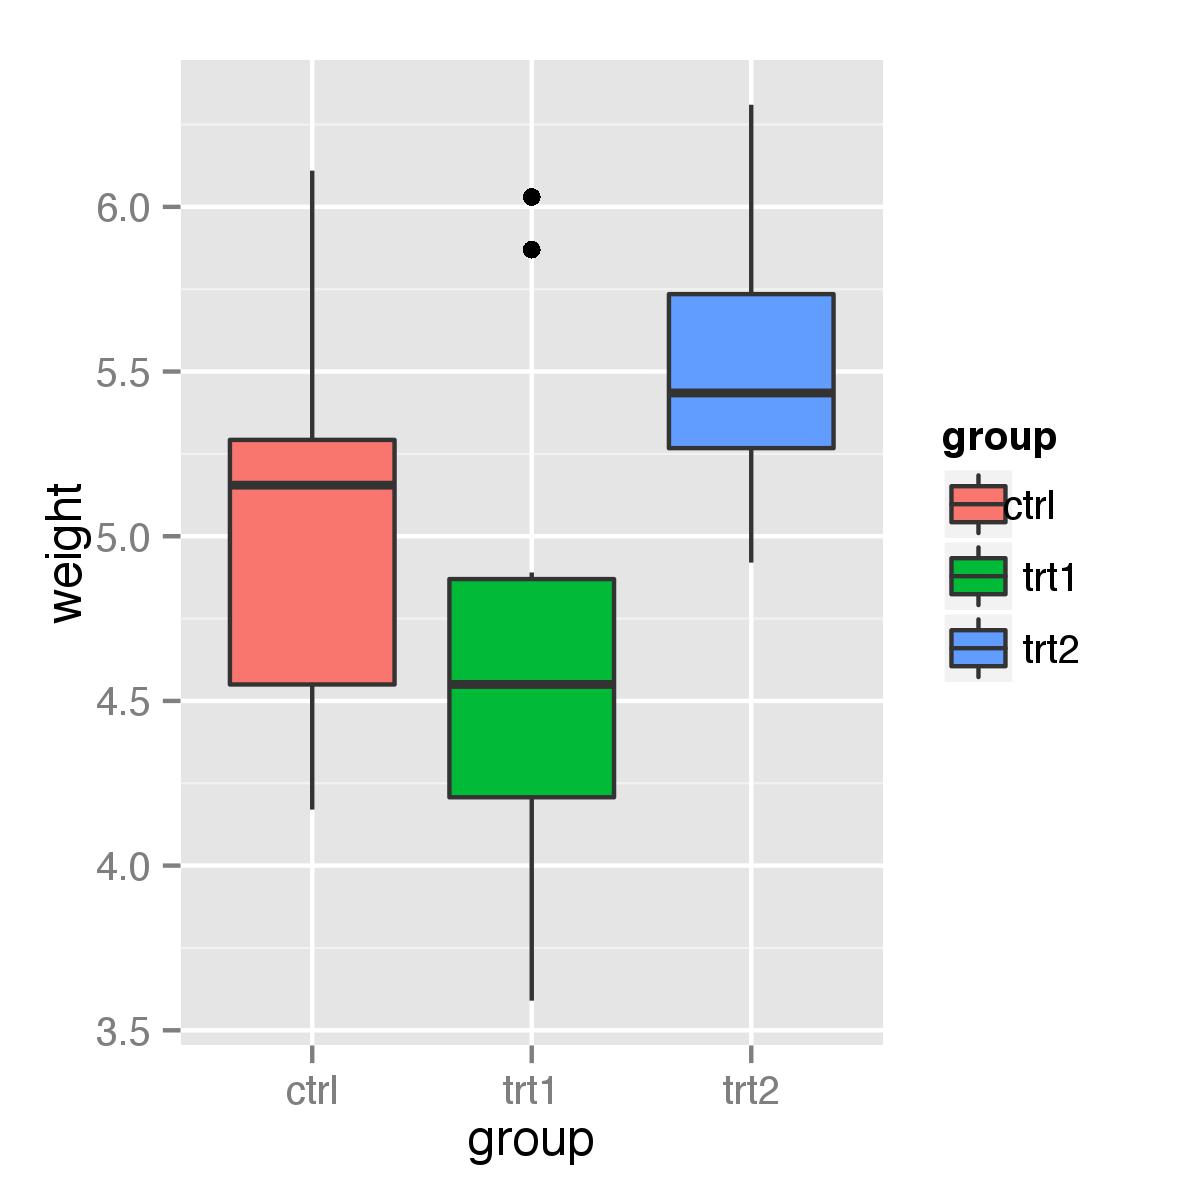
p<-ggplot(data=PlantGrowth, aes(x=group, y=weight, fill=group)) + geom_boxplot()
p + theme(legend.text.align = 0)
p + theme(legend.text.align = 1)
p + theme(legend.text.align = -10)
I would have expected each legend text item to be translated the same distance, so I would concur that something appears amiss.
Dennis
Brandon Hurr
Aug 21, 2013, 10:23:21 AM8/21/13
to Dennis Murphy, Martin, ggplot2

Ista Zahn
Aug 21, 2013, 12:34:02 PM8/21/13
to Brandon Hurr, Dennis Murphy, Martin, ggplot2
I don't have a solution to the original problem, but I suspect there simply isn't a knob for that. But I don't think there is a label.hjust bug (other than perhaps a documentation issue; like all the other hjust arguments it should be between zero and 1). label.hjust works as intended:
p+scale_fill_discrete(breaks = levels(PlantGrowth$group),
labels = c("short", "longer", "a really long label"),
guide = guide_legend(label.hjust=0))
p+scale_fill_discrete(breaks = levels(PlantGrowth$group),
labels = c("short", "longer", "a really long label"),
guide = guide_legend(label.hjust=1))
it's just not intended for what you are trying to do with it.
Best,
Ista
Brandon Hurr
Aug 21, 2013, 1:04:56 PM8/21/13
to Ista Zahn, Dennis Murphy, Martin, ggplot2
Ah! Yes, I've totally forgotten what it was intended for. I have used it in this manner when looking at axis tick labels to some positive effect. I see what OP means though, sometimes the icon for the point/line/boxplot is too far from the text. I suppose this means it's more of a feature request than a bug.
Any idea on how the legend is built? There must be some predetermined way that spaces these things a certain distance. If so, I can't see why such an adjustment couldn't be added. I just have no idea where to look.

baptiste auguie
Aug 21, 2013, 1:21:52 PM8/21/13
to Brandon Hurr, Ista Zahn, Dennis Murphy, Martin, ggplot2
On 21 August 2013 14:04, Brandon Hurr <brando...@gmail.com> wrote:
Any idea on how the legend is built? There must be some predetermined way that spaces these things a certain distance. If so, I can't see why such an adjustment couldn't be added. I just have no idea where to look.
probably around this line:
you could also edit the gtable (contained within a gtable, within a gtable...).
b.
baptiste auguie
Aug 21, 2013, 6:02:23 PM8/21/13
to Brandon Hurr, Ista Zahn, Dennis Murphy, Martin, ggplot2
Here's an example editing the gtable,
it's quite fiddly to navigate, because there are three layers of gtables.
HTH,
b.
Martin
Aug 22, 2013, 3:58:01 AM8/22/13
to ggp...@googlegroups.com
Hi all,
thanks for your responses and ideas, I agree with Ista....I suppose there is simply no option implemented yet to adjust the distance between legend text and symbols.
It only becomes an issue when one reduces the symbol size because the text stays put.
Thanks Baptiste for the workaround using grid (grid is great, I wonder why it never really caught on).
Cheers
M
Brandon Hurr
Aug 22, 2013, 3:59:45 AM8/22/13
to baptiste auguie, Ista Zahn, Dennis Murphy, Martin, ggplot2
Thanks Baptiste... That is a very VERY deep rabbit hole.
Looks like it's the 4th element that provides the spacing. The second unit is important as it affects the drawing width for the icon (mini boxplot). Otherwise, I've zeroed them all and 1, 3, 5:6 don't seem to make much difference (AFAICT).
1 and 5 are exactly 1.5 mm which is the "padding" defined in the .r file. I bet if I drew the box around the legend if it would be really tight around it now. Still don't know what 6 is for.
orig <- g[["grobs"]][[8]][["grobs"]][[1]][["widths"]]
orig<-unit.c(unit(0, "mm"), orig[2], unit(0, "mm"), unit(0, "mm"), unit(0, "mm"), unit(0, "mm"))
g[["grobs"]][[8]][["grobs"]][[1]][["widths"]]<-orig
grid.newpage()
grid.draw(g)
Reply all
Reply to author
Forward
0 new messages