positional guides

Kohske Takahashi
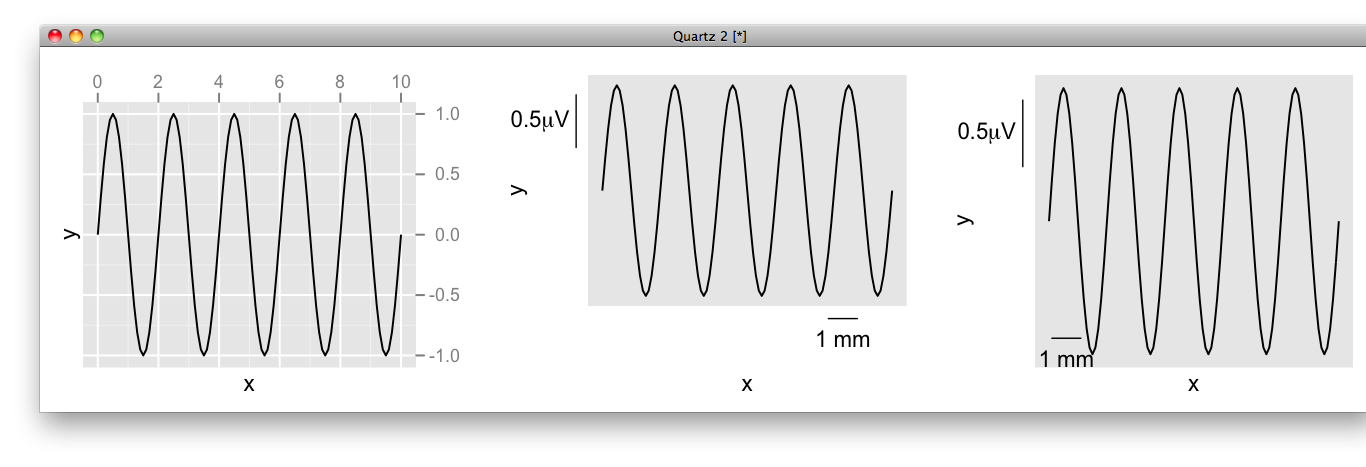
Here is an initial implementation of the next version of position guide.
x <- seq(0, 10, 0.1)
y <- sin(x * pi)
qplot(x, y, geom = "line") +
scale_x_continuous(guide = guide_axis(position = "top")) +
scale_y_continuous(guide = guide_axis(position = "right"))
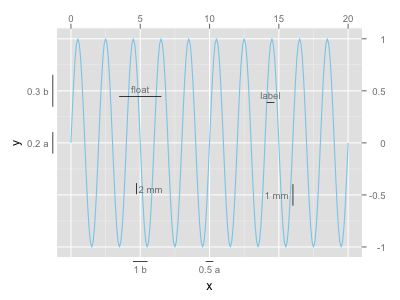
qplot(x, y, geom = "line") +
scale_x_continuous(guide = guide_range(size = 1, label = "1 mm")) +
scale_y_continuous(guide = guide_range(size = 0.5, label =
expression(paste(0.5, mu, "V")))) +
opts(panel.grid.major = theme_blank(), panel.grid.minor = theme_blank())
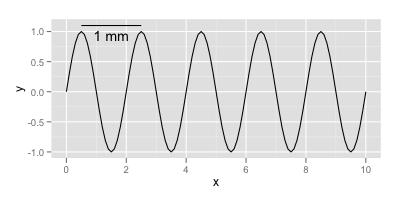
qplot(x, y, geom = "line") +
scale_x_continuous(guide = guide_range(size = 1, label = "1 mm",
position = c(0.1, 0.1))) +
scale_y_continuous(guide = guide_range(size = 0.5, label =
expression(paste(0.5, mu, "V")))) +
opts(panel.grid.major = theme_blank(), panel.grid.minor = theme_blank())
the images are attached.
some syntax suger like this will appear.
+guides(x = "range", y = "axis-top")
I have a few questions:
- Is this interface reasonable?
- Is there any popular positional guides?
- What features do you want in the axis/range guides?
- Or, any comments and suggestions are welcome.
thanks,
kohske
--
Kohske Takahashi <takahash...@gmail.com>
Research Center for Advanced Science and Technology,
The University of Tokyo, Japan.
http://www.fennel.rcast.u-tokyo.ac.jp/profilee_ktakahashi.html

Tengfei Yin
thanks,
kohske
--
Kohske Takahashi <takahash...@gmail.com>
Research Center for Advanced Science and Technology,
The University of Tokyo, Japan.
http://www.fennel.rcast.u-tokyo.ac.jp/profilee_ktakahashi.html
Tengfei Yin
MCDB PhD student
1620 Howe Hall, 2274,
Iowa State University
Ames, IA,50011-2274
Homepage: www.tengfei.name
Kohske Takahashi
guide_axis will have parameters to control which element should be
drawn, like this:
x = guide_axis(ticks = NULL, label = NULL)
default value is "waiver()" then the ticks etc are determined
depending on the theme.
These are just my idea, and may be changed.
kohske
2012/2/20 Tengfei Yin <yinte...@gmail.com>:
--
Tengfei Yin
Hi
guide_axis will have parameters to control which element should be
drawn, like this:
x = guide_axis(ticks = NULL, label = NULL)
default value is "waiver()" then the ticks etc are determined
depending on the theme.

Hadley Wickham
<takahash...@gmail.com> wrote:
> Hi dev members,
>
> Here is an initial implementation of the next version of position guide.
>
> x <- seq(0, 10, 0.1)
> y <- sin(x * pi)
>
> qplot(x, y, geom = "line") +
> scale_x_continuous(guide = guide_axis(position = "top")) +
> scale_y_continuous(guide = guide_axis(position = "right"))
Can you put them on both the left and right, top and bottom?
> qplot(x, y, geom = "line") +
> scale_x_continuous(guide = guide_range(size = 1, label = "1 mm")) +
> scale_y_continuous(guide = guide_range(size = 0.5, label =
> expression(paste(0.5, mu, "V")))) +
> opts(panel.grid.major = theme_blank(), panel.grid.minor = theme_blank())
What about something like: guide_range <- function(size, unit, label =
paste(size, unit)) ?
but with more logic for when unit is an expression.
I really like these range bars!
> qplot(x, y, geom = "line") +
> scale_x_continuous(guide = guide_range(size = 1, label = "1 mm",
> position = c(0.1, 0.1))) +
> scale_y_continuous(guide = guide_range(size = 0.5, label =
> expression(paste(0.5, mu, "V")))) +
> opts(panel.grid.major = theme_blank(), panel.grid.minor = theme_blank())
>
> the images are attached.
>
> some syntax suger like this will appear.
> +guides(x = "range", y = "axis-top")
>
> I have a few questions:
>
> - Is this interface reasonable?
> - Is there any popular positional guides?
You did a table one somewhere, right? (i.e. if you want to have a
table lined up with values on the axis)
> - What features do you want in the axis/range guides?
How about one where you could place arbitrary grobs? i.e. country
flags instead of country names, or other images for discrete scales
where they would help (I don't know of any good examples off the top
of my head).
How hard would it be to do a circular axis for polar coordinate plots?
Otherwise, I skimmed through the GoG and I didn't see anything else
that we should do. There might be other examples in R Graphics, but I
don't have it handy.
Hadley
--
Assistant Professor / Dobelman Family Junior Chair
Department of Statistics / Rice University
http://had.co.nz/
Hadley Wickham
> that we should do. There might be other examples in R Graphics, but I
> don't have it handy.
You may also want to solicit suggestions from the main ggplot2 mailing list.
Kohske Takahashi
> On Mon, Feb 20, 2012 at 9:19 PM, Kohske Takahashi
> <takahash...@gmail.com> wrote:
>> Hi dev members,
>>
>> Here is an initial implementation of the next version of position guide.
>>
>> x <- seq(0, 10, 0.1)
>> y <- sin(x * pi)
>>
>> qplot(x, y, geom = "line") +
>> scale_x_continuous(guide = guide_axis(position = "top")) +
>> scale_y_continuous(guide = guide_axis(position = "right"))
>
> Can you put them on both the left and right, top and bottom?
Definitely yes, I will do that.
The interface will be like this:
guide = list(guide_axis(position = "top"), guide_axis(position = "bottom"))
You may combine different types of guides
guide = list(guide_axis(position = "top"), guide_range(position = "bottom"))
>
>> qplot(x, y, geom = "line") +
>> scale_x_continuous(guide = guide_range(size = 1, label = "1 mm")) +
>> scale_y_continuous(guide = guide_range(size = 0.5, label =
>> expression(paste(0.5, mu, "V")))) +
>> opts(panel.grid.major = theme_blank(), panel.grid.minor = theme_blank())
>
> What about something like: guide_range <- function(size, unit, label =
> paste(size, unit)) ?
>
> but with more logic for when unit is an expression.
Good idea. easy to hack.
>
> I really like these range bars!
>
>> qplot(x, y, geom = "line") +
>> scale_x_continuous(guide = guide_range(size = 1, label = "1 mm",
>> position = c(0.1, 0.1))) +
>> scale_y_continuous(guide = guide_range(size = 0.5, label =
>> expression(paste(0.5, mu, "V")))) +
>> opts(panel.grid.major = theme_blank(), panel.grid.minor = theme_blank())
>>
>> the images are attached.
>>
>> some syntax suger like this will appear.
>> +guides(x = "range", y = "axis-top")
>>
>> I have a few questions:
>>
>> - Is this interface reasonable?
>> - Is there any popular positional guides?
>
> You did a table one somewhere, right? (i.e. if you want to have a
> table lined up with values on the axis)
>
Yes, guide_table will appear in future.
I don't want to write the table grob itself, though...
>> - What features do you want in the axis/range guides?
>
> How about one where you could place arbitrary grobs? i.e. country
> flags instead of country names, or other images for discrete scales
> where they would help (I don't know of any good examples off the top
> of my head).
>
You may replace labels by arbitrary grobs, like this:
guide_axis(labels = function(...) {grob_of_pictures})
> How hard would it be to do a circular axis for polar coordinate plots?
In my view, this is quite difficult, so initially I will begin with
linear coords.
thanks
> Otherwise, I skimmed through the GoG and I didn't see anything else
> that we should do. There might be other examples in R Graphics, but I
> don't have it handy.
>
> Hadley
>
> --
> Assistant Professor / Dobelman Family Junior Chair
> Department of Statistics / Rice University
> http://had.co.nz/
--
Hadley Wickham
>>> scale_x_continuous(guide = guide_axis(position = "top")) +
>>> scale_y_continuous(guide = guide_axis(position = "right"))
>>
>> Can you put them on both the left and right, top and bottom?
>
> Definitely yes, I will do that.
>
> The interface will be like this:
> guide = list(guide_axis(position = "top"), guide_axis(position = "bottom"))
>
> You may combine different types of guides
> guide = list(guide_axis(position = "top"), guide_range(position = "bottom"))
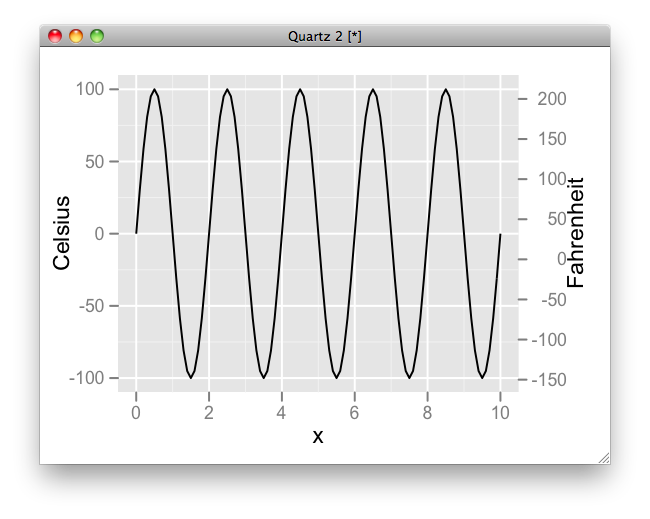
In that case it would be useful to provide a helper function that
would create a linearly-rescaled scale - i.e. if you wanted to have
the left scale be in celsius and the right in Fahrenheit. That's
currently possible by setting the appropriate breaks and labels
function, but it would be nice to have a convenient wrapper.
Kohske Takahashi
>> The interface will be like this:
>> guide = list(guide_axis(position = "top"), guide_axis(position = "bottom"))
>>
>> You may combine different types of guides
>> guide = list(guide_axis(position = "top"), guide_range(position = "bottom"))
>
> In that case it would be useful to provide a helper function that
> would create a linearly-rescaled scale - i.e. if you wanted to have
> the left scale be in celsius and the right in Fahrenheit. That's
> currently possible by setting the appropriate breaks and labels
> function, but it would be nice to have a convenient wrapper.
Totally agree.
guide_axis should accept breaks (and minor breaks) parameter that
overrides default scale's breaks.

Winston Chang
Kohske Takahashi
> - Is it possible to have both the axis guide and the range guide?
Yes, but not yet.
> - I assume that 'size' is the length of the line, in the data space. For
> consistency, you may want to use 'size' for the line thickness, and 'length'
> for the length.
Ok, length will be reasonable.
> - It looks like positioning is done panel's coordinate space, which goes
> from 0 to 1 on each axis. It may also be useful to be able to control the
> position in the data space. For example, you might want the guide to start
> at the 0 point of your data. I think this would also be useful when the
> guide is placed outside the plotting region.
Probably easy, but I'm not sure what type of interface you are imagining.
Could you please show some example usage?
> - Is it possible to control the amount of space allocated for the
> guide_range? The x axis label is very far away from the plotting area, and
> bringing it closer would look better.
Probably yes.
> - I don't know if this is worth the trouble, but it would also be nice to
> have a dual-scale guide. If you look at Google maps, it shows the length for
> both km and miles, with one on top of the line and one on the bottom. (This
> would also require end markers for the lines)
Definitely yes. This is the main purpose of putting the guides on both side.
> - Is there a way to control the line ends? I think it would be useful to
> have the option of having flat ends (like error bars), and ones that are on
> one side only, as in Google maps (mentioned above).
Probably yes, but not yet.
Actually we need to consider about style specification.
> - It would be useful to put something like "minor ticks" on the range guide.
> For example, when you set size=1, you might also want tick marks every 0.2.
Absolutely yes, but not yet. The minor ticks are placed at the minor_breaks.
Thanks a lot.
kohske
--

baptiste auguie
On 22 February 2012 00:09, Kohske Takahashi <takahash...@gmail.com> wrote:
>
>>
>> You did a table one somewhere, right? (i.e. if you want to have a
>> table lined up with values on the axis)
>>
>
> Yes, guide_table will appear in future.
> I don't want to write the table grob itself, though...
I can probably change gridExtra::tableGrob so that it accepts variable
width and height. Its code has become really complicated and messy,
unfortunately..
One might also want to add a continuous image scale, e.g. a colour
spectrum for spectroscopic data, e.g. as in Fig 5 of this article:
http://onlinelibrary.wiley.com/doi/10.1002/anie.201007536/full
Thanks!
baptiste
Kohske Takahashi
> I can probably change gridExtra::tableGrob so that it accepts variable
> width and height. Its code has become really complicated and messy,
> unfortunately..
>
Excellent!! Actually I have hoped that ;-p
> One might also want to add a continuous image scale, e.g. a colour
> spectrum for spectroscopic data, e.g. as in Fig 5 of this article:
> http://onlinelibrary.wiley.com/doi/10.1002/anie.201007536/full
>
Maybe it will appear, but you can use geom_raster for this purpose.
If anything, I'm interested in the both-side axis of the Fig. 5b.
thanks,
kohske
Kohske Takahashi
# data
x <- seq(0, 10, 0.1)
y <- sin(x * pi) * 100
# labels for F
yf <- pretty(9/5*y + 32, n = 10)
# breaks for F at C space
yc <- 5/9*(yf-32)
# guide for C
gc <- guide_axis(position = "left", title = "Celsius")
# guide for F
gf <- guide_axis(position = "right", breaks = yc, label = yf, title =
"Fahrenheit")
# plot
p1 <- qplot(x, y, geom = "line") +
scale_y_continuous(guide = list(gc, gf)) +
labs(y = NULL)
breaks and labels are generated by scale_X by default, but it can be
overrided by hand.
Maybe is there better way?
I will put it on a github in near future.
Any comments and suggestions are welcome.
thanks,
2012/2/21 Kohske Takahashi <takahash...@gmail.com>:
Hadley Wickham
<takahash...@gmail.com> wrote:
> As for the both-side axis, now it looks like this:
>
> # data
> x <- seq(0, 10, 0.1)
> y <- sin(x * pi) * 100
>
> # labels for F
> yf <- pretty(9/5*y + 32, n = 10)
> # breaks for F at C space
> yc <- 5/9*(yf-32)
>
> # guide for C
> gc <- guide_axis(position = "left", title = "Celsius")
>
> # guide for F
> gf <- guide_axis(position = "right", breaks = yc, label = yf, title =
> "Fahrenheit")
>
> # plot
> p1 <- qplot(x, y, geom = "line") +
> scale_y_continuous(guide = list(gc, gf)) +
> labs(y = NULL)
>
> breaks and labels are generated by scale_X by default, but it can be
> overrided by hand.
> Maybe is there better way?
I was thinking it would be nice if you could do something like:
gf <- guide_axis(position = "right", transform = function(x) 9/5*x + 32)
And for title, the order of precedence is guide, then scale, then options?
baptiste auguie
>>
>> I can probably change gridExtra::tableGrob so that it accepts variable
>> width and height. Its code has become really complicated and messy,
>> unfortunately..
>>
>
> Excellent!! Actually I have hoped that ;-p
>
>> One might also want to add a continuous image scale, e.g. a colour
>> spectrum for spectroscopic data, e.g. as in Fig 5 of this article:
>> http://onlinelibrary.wiley.com/doi/10.1002/anie.201007536/full
>>
>
> Maybe it will appear, but you can use geom_raster for this purpose.
> If anything, I'm interested in the both-side axis of the Fig. 5b.
For this I used the following code,
## conversion energy - wavelength (nonlinear)
`eV2L` <- function(eV)
{
c <- 2.99792458e8
h <- 6.62606896e-34
ee <- 1.602176487e-19
h * c / ee / eV
}
library(grid)
grid.newpage()
pushViewport(dataViewport(xscale=c(100, 1500), yscale=c(0, 1)))
grid.segments(100, unit(0.5, "npc"), 1500, unit(0.5, "npc"),
def="native", arrow=arrow())
wavelengths <- seq(200, 1200, by=200)
eV <- c(10, 5, 2, 1.5, 1)
weVs <- eV2L(eV)*1e9
grid.segments(wavelengths, unit(0.5, "npc"), wavelengths, unit(0.5,
"npc")-unit(2, "mm"), def="native")
grid.segments(weVs, unit(0.5, "npc"), weVs, unit(0.5, "npc")+unit(2,
"mm"), def="native")
grid.text(wavelengths, wavelengths, unit(0.5, "npc"), def="native", vjust=2)
grid.text(eV, weVs, unit(0.51, "npc"), def="native", vjust=-1)
Cheers,
Kohske Takahashi
> I was thinking it would be nice if you could do something like:
>
> gf <- guide_axis(position = "right", transform = function(x) 9/5*x + 32)
>
Yes, and we need to think about pretty break. something like this?
gf <- guide_axis(position = "right", transform = function(x) 9/5*x +
32, breaks = function(x) pretty(x))
by default, breaks = pretty, but users can use their own breaking function.
> And for title, the order of precedence is guide, then scale, then options?
yes, but here things are quite complicated.
Some guides have a title but some don't maybe.
So, now I'm not sure how to handle title.
I mean that plot-render need to know if there is a title of guide.
One way is that guide grob has an attribute indicating if it has a title.
But maybe there are multiple guides or there is no guide, and how the
plot-render can know if it should draw a title?
So another way is to keep title of guides completely separated from
the title of scale. I like this way.
This means, there can be the title of the plot (or panel) and the
title of the guide.
hard to explain though...
Feel free to ask in more details.
Kohske Takahashi
Hadley Wickham
>
> gf <- guide_axis(position = "right", transform = function(x) 9/5*x +
> 32, breaks = function(x) pretty(x))
>
> by default, breaks = pretty, but users can use their own breaking function.
But that functionality exists already, right?
>> And for title, the order of precedence is guide, then scale, then options?
>
> yes, but here things are quite complicated.
> Some guides have a title but some don't maybe.
> So, now I'm not sure how to handle title.
>
> I mean that plot-render need to know if there is a title of guide.
> One way is that guide grob has an attribute indicating if it has a title.
> But maybe there are multiple guides or there is no guide, and how the
> plot-render can know if it should draw a title?
>
> So another way is to keep title of guides completely separated from
> the title of scale. I like this way.
> This means, there can be the title of the plot (or panel) and the
> title of the guide.
I think that sounds good.
baptiste auguie
the breaks independently for each panel (especially the limits, and
number of breaks). Could guide_axis() somehow gain an argument that
modifies its breaks depending on the facet id?
Thanks,
baptiste
Hadley Wickham
> the breaks independently for each panel (especially the limits, and
> number of breaks). Could guide_axis() somehow gain an argument that
> modifies its breaks depending on the facet id?
I think that's something that needs to change at the facets/scales level.
Kohske Takahashi
>
> But that functionality exists already, right?
Yes, right.
>> So another way is to keep title of guides completely separated from
>> the title of scale. I like this way.
>> This means, there can be the title of the plot (or panel) and the
>> title of the guide.
>
> I think that sounds good.
Ok, I will go this way at first.
thanks,
kohske
>
> Hadley
>
>
> --
> Assistant Professor / Dobelman Family Junior Chair
> Department of Statistics / Rice University
> http://had.co.nz/
--
Kohske Takahashi
>> In facetted plots, it is sometimes very useful to be able to specify
>> the breaks independently for each panel (especially the limits, and
>> number of breaks). Could guide_axis() somehow gain an argument that
>> modifies its breaks depending on the facet id?
>
> I think that's something that needs to change at the facets/scales level.
Yes, we need some interfaces that enables to pass some panel-specific
parameters.
kohske
>
> Hadley
>
> --
> Assistant Professor / Dobelman Family Junior Chair
> Department of Statistics / Rice University
> http://had.co.nz/
--
Winston Chang
> - It looks like positioning is done panel's coordinate space, which goesProbably easy, but I'm not sure what type of interface you are imagining.
> from 0 to 1 on each axis. It may also be useful to be able to control the
> position in the data space. For example, you might want the guide to start
> at the 0 point of your data. I think this would also be useful when the
> guide is placed outside the plotting region.
Could you please show some example usage?
Kohske Takahashi
> I was thinking something like this:
>
> x <- seq(0, 10, 0.1)
> y <- sin(x * pi)
>
> qplot(x, y, geom = "line") +
> scale_x_continuous(guide = guide_range(size = 1, label = "1 mm",
> position = c(0.5, 1.1), coord = "data"))
>
> The default could be coord="panel".
ah, ok. then this is the option for guide_range, right?
thanks,
kohske
Kohske Takahashi
> I was thinking it would be nice if you could do something like:
>
> gf <- guide_axis(position = "right", transform = function(x) 9/5*x + 32)
Unfortunately we need inverse function of transform.
This is because,
1) transform the range of data space into new space by transform function.
2) pretty breaks on the new space -> new breaks.
3) new breaks are only used for label.
4) new breaks need to be placed on the data space. here the new space
need to be inv-transed into data space.
One way is to explicitly require the inverse function such as,
transform = ..., inverse = ...
but this may be quite tough for users.
Another way is to assume linear transform if the inverse is missing,
with explicit warning message.
This works the transform is linear, but will not for non-linear
transform, e.g., data is liner space and additional log-space axis is
shown by transform = function(x) log(x).
kohske
>
> And for title, the order of precedence is guide, then scale, then options?
>
> Hadley
>
> --
> Assistant Professor / Dobelman Family Junior Chair
> Department of Statistics / Rice University
> http://had.co.nz/
--
Hadley Wickham
<takahash...@gmail.com> wrote:
>>
>> I was thinking it would be nice if you could do something like:
>>
>> gf <- guide_axis(position = "right", transform = function(x) 9/5*x + 32)
>
> Unfortunately we need inverse function of transform.
> This is because,
>
> 1) transform the range of data space into new space by transform function.
> 2) pretty breaks on the new space -> new breaks.
> 3) new breaks are only used for label.
> 4) new breaks need to be placed on the data space. here the new space
> need to be inv-transed into data space.
>
> One way is to explicitly require the inverse function such as,
> transform = ..., inverse = ...
Oh, yes, good point!
Kohske Takahashi
I have uploaded the initial implementation of position guide.
https://github.com/kohske/ggplot2/tree/feature/pguide
Now, it works only with facet-null.
At the moment, two type of guides, guide-axis and guide-range are implemented
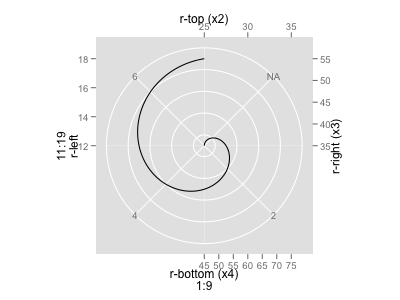
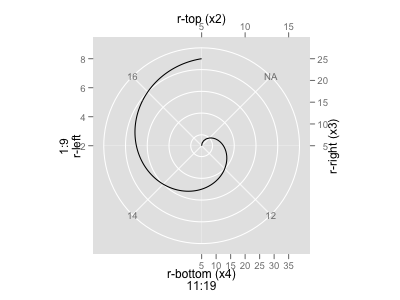
* guide-axis can work with coord-cartesian, coord-flip, and coord-polar.
* guide-range can work only with coord-cartesian.
you can find the test codes at inst/tests/visual-position-guides.r
Please find the attached images of the example outputs.
Any comments and suggestions are welcome.
thanks,
kohske
2012年2月23日18:06 Hadley Wickham <had...@rice.edu>:
--
Kohske Takahashi
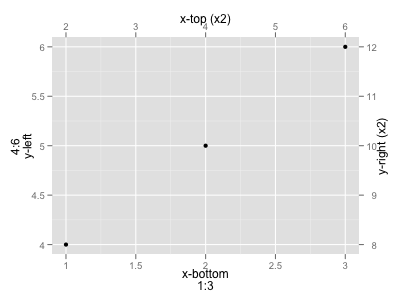
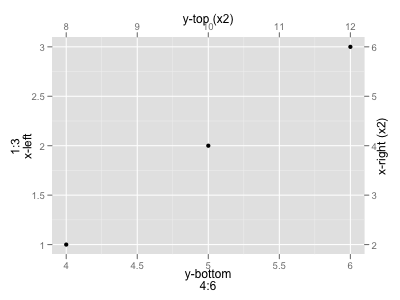
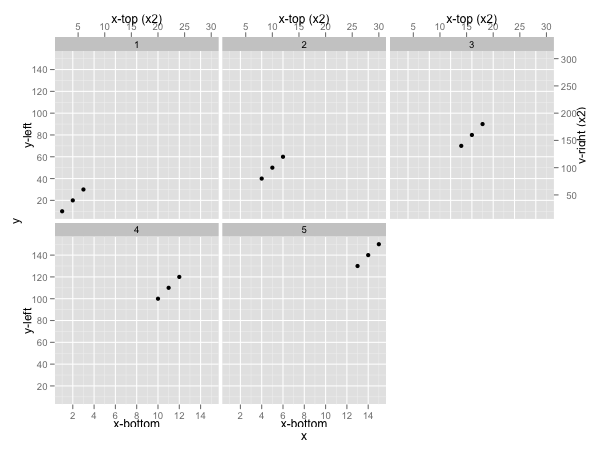
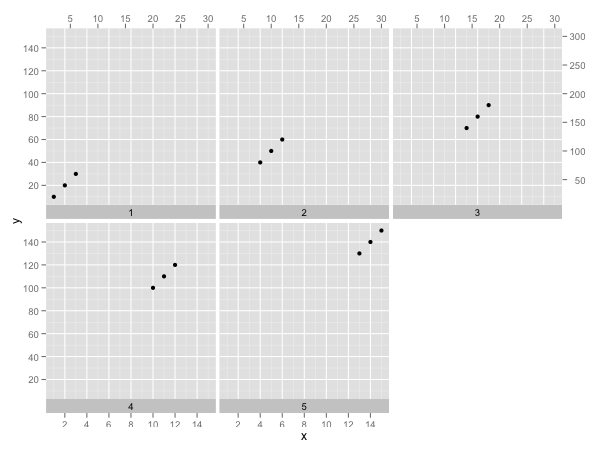
Here is a sneak peak of the position guides with facet_wrap.
I will push it after some improvement of codes.
Here is examples:
df <- data.frame(x = 1:15, y = 1:15*10, g = gl(5, 3))
ggplot(df, aes_auto(df)) + geom_point() + facet_wrap(~g) +
scale_x_continuous(guide = list(
guide_axis(title = "x-bottom"),
guide_axis(title = "x-top (x2)", position = "top", trans =
function(x) x * 2))) +
scale_y_continuous(guide = list(
guide_axis(title = "y-left"),
guide_axis(title = "y-right (x2)", position = "right", trans =
function(x) x * 2)))
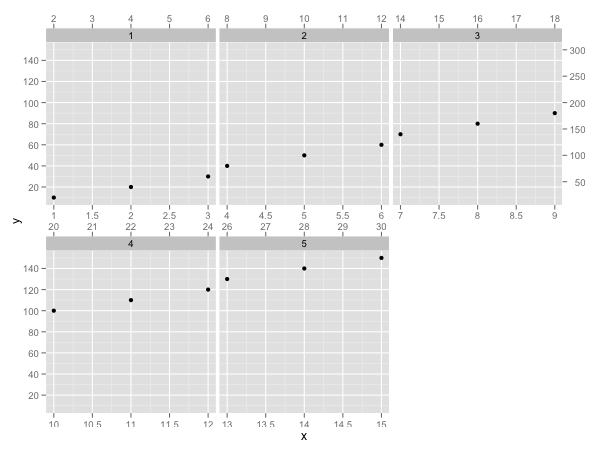
ggplot(df, aes_auto(df)) + geom_point() + facet_wrap(~g, scales = "free") +
scale_x_continuous(guide = list(
guide_axis(),
guide_axis(position = "top", trans = function(x) x * 2))) +
scale_y_continuous(guide = list(
guide_axis(),
guide_axis(position = "right", trans = function(x) x * 2)))
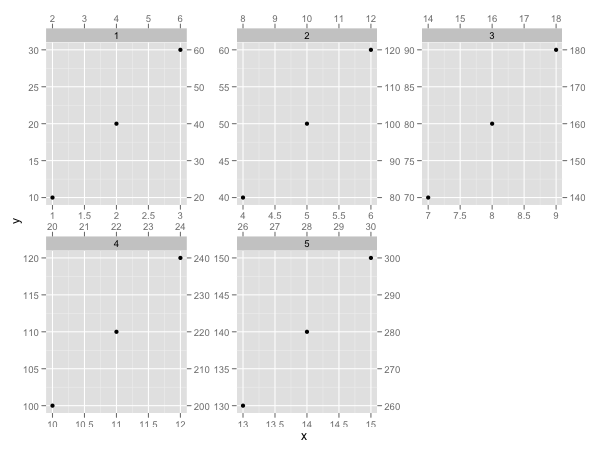
ggplot(df, aes_auto(df)) + geom_point() + facet_wrap(~g, scales = "free_x") +
scale_x_continuous(guide = list(
guide_axis(),
guide_axis(position = "top", trans = function(x) x * 2))) +
scale_y_continuous(guide = list(
guide_axis(),
guide_axis(position = "right", trans = function(x) x * 2)))
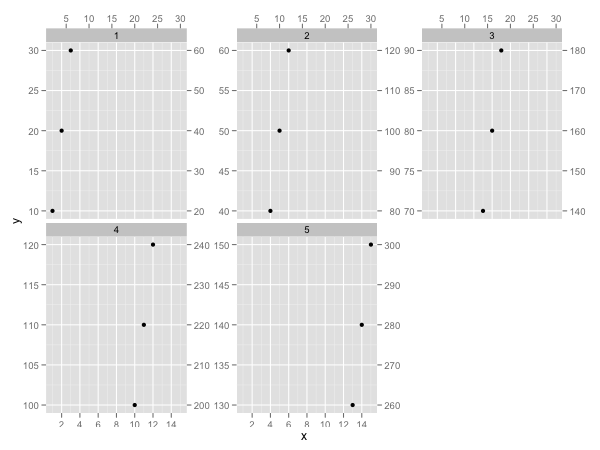
ggplot(df, aes_auto(df)) + geom_point() + facet_wrap(~g, scales = "free_y") +
scale_x_continuous(guide = list(
guide_axis(),
guide_axis(position = "top", trans = function(x) x * 2))) +
scale_y_continuous(guide = list(
guide_axis(),
guide_axis(position = "right", trans = function(x) x * 2)))
ggplot(df, aes_auto(df)) + geom_point() + facet_wrap(~g, strip = "bottom") +
scale_x_continuous(guide = list(
guide_axis(),
guide_axis(position = "top", trans = function(x) x * 2))) +
scale_y_continuous(guide = list(
guide_axis(),
guide_axis(position = "right", trans = function(x) x * 2)))
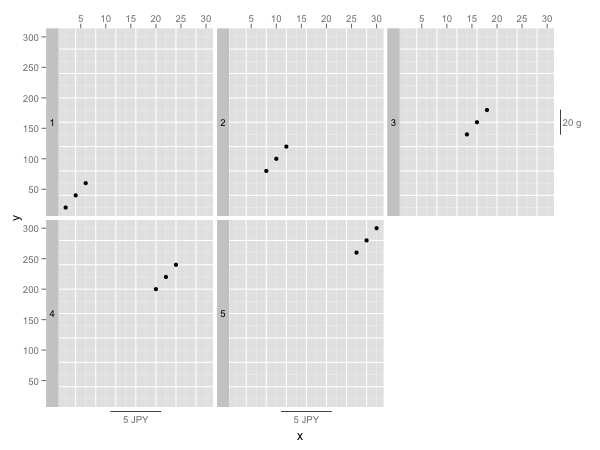
ggplot(df, aes_auto(df)) + geom_point() + facet_wrap(~g, strip = "left") +
scale_x_continuous(guide = list(
guide_range(length = 5, unit = "JPY"),
guide_axis(position = "top", trans = function(x) x * 2))) +
scale_y_continuous(guide = list(
guide_range(position = "right", length = 20, unit = "g"),
guide_axis(trans = function(x) x * 2)))
2012年3月1日7:37 Kohske Takahashi <takahash...@gmail.com>: