[slightly off-topic] ggExtra deprecated

baptiste
I've removed ggExtra from googlecode and r-forge; this experimental
package had become redundant and unreliable with the upcoming version
of ggplot2.
I'll consider starting a new version from scratch, on github, after I
become more familiar with the new framework of ggplot2. I believe
there is a niche for sharing experimental code, geoms, themes and add-
ons aside from the core ggplot2 development.
Looking forward to the Christmas release of ggplot2 :)
Cheers,
baptiste
baptiste

Hadley Wickham
> become more familiar with the new framework of ggplot2. I believe
> there is a niche for sharing experimental code, geoms, themes and add-
> ons aside from the core ggplot2 development.
Totally agreed!
One thing that the new version should support much better is the
ability to line up multiple plots on a page. I'm not really interested
in this myself, but the new gtable object should make it much easier
to introspect the layout of a plot and combine multiple plots
together. The gtable code will eventually be moved into its own
package, which I hope will make it easier for other's to contribute to
- I suspect there still performance improvements to be made.
Hadley
--
Assistant Professor / Dobelman Family Junior Chair
Department of Statistics / Rice University
http://had.co.nz/

Winston Chang
Hadley Wickham
> easier to collaborate.
And I think there is no advantage to using r-forge now that you can
use install_github to try out a package from a github repo.

Bryan Hanson
Thanks, Bryan
baptiste auguie
>> I like the idea of putting it on github -- it definitely makes it a lot
>> easier to collaborate.
>
> And I think there is no advantage to using r-forge now that you can
> use install_github to try out a package from a github repo.
In theory, r-forge could still be useful for packages that contain
external code. In practice, I found r-forge build+check process and
website very unreliable.
baptiste
Hadley Wickham
>> use install_github to try out a package from a github repo.
>
> In theory, r-forge could still be useful for packages that contain
> external code. In practice, I found r-forge build+check process and
> website very unreliable.
One thing that would be really useful would be an external continuous
integration service that would monitor a git repo, pull down any
changes and run R CMD check on mac, linux and windows and report any
changes. This would require considerable time to set up though.
baptiste auguie
> Baptiste, could you forward a list of functions that were in ggExtra? I think I'm using it for something but I can't find where just now.
Sure – let me know if you need the code for one of these,
custom themes
===========
ls(pattern="theme",package:ggExtra)
[1] "display.theme " "element.theme " "theme_bb " "theme_bw2 "
[5] "theme_dark " "theme_flashy " "theme_gray2 " "theme_minimal "
[9] "theme_talk "
experimental geoms
==============
ls(pattern="geom",package:ggExtra)
[1] "geom_custom" "geom_ebimage" "geom_ellipse" "geom_field"
[5] "geom_fielduv" "geom_ngon" "geom_pixmap" "geom_point2"
[9] "geom_raster" "geom_star" "geom_table"
scales
=====
ls(pattern="scale",package:ggExtra)
[1] "scale_abscissa" "scale_alpha_manual"
[3] "scale_angle" "scale_angle_discrete"
[5] "scale_angle_manual" "scale_ar"
[7] "scale_ar_discrete" "scale_ar_manual"
[9] "scale_colour_dichromat" "scale_fill_dichromat"
[11] "scale_length" "scale_length_manual"
[13] "scale_lex" "scale_lex_discrete"
[15] "scale_lex_manual" "scale_ordinate"
[17] "scale_sides" "scale_sides_manual"
convenience functions
================
setdiff(ls(package:ggExtra),
ls(pattern="geom|scale|theme|Scale|Geom|Grob",package:ggExtra))
[1] "area" "align.plots" "chooseCol"
[4] "createCol" "dichromat.maxcolors" "dichromat.names"
[7] "dichromat.pal" "dichromat.types"
baptiste
Bryan Hanson
p <- p + annotate("table", table[1], table[2], table = mod,
theme = theme.list(show.box = TRUE, separator = "black",
gp = gpar(cex = table[3]), show.csep = TRUE,
show.rsep = TRUE, show.colnames = TRUE, show.rownames = TRUE,
gpar.rowtext = gpar(col = "black", cex = 1,
fontface = "bold")))
I will obviously disable this in my functions but I really hope something equivalent will re-appear. This is a very useful feature. I'll beg if needed!
Thanks, Bryan
baptiste auguie
gridExtra. I think a more useful geom would be a generic geom_custom
(an initial version was also in ggExtra) that lets you place an
arbitrary grob at a given location in the ggplot2 coordinate system.
It's probably quite easy to adapt for the new ggplot2, I'll have a
look.
Cheers,
baptiste
Bryan Hanson

Kohske Takahashi
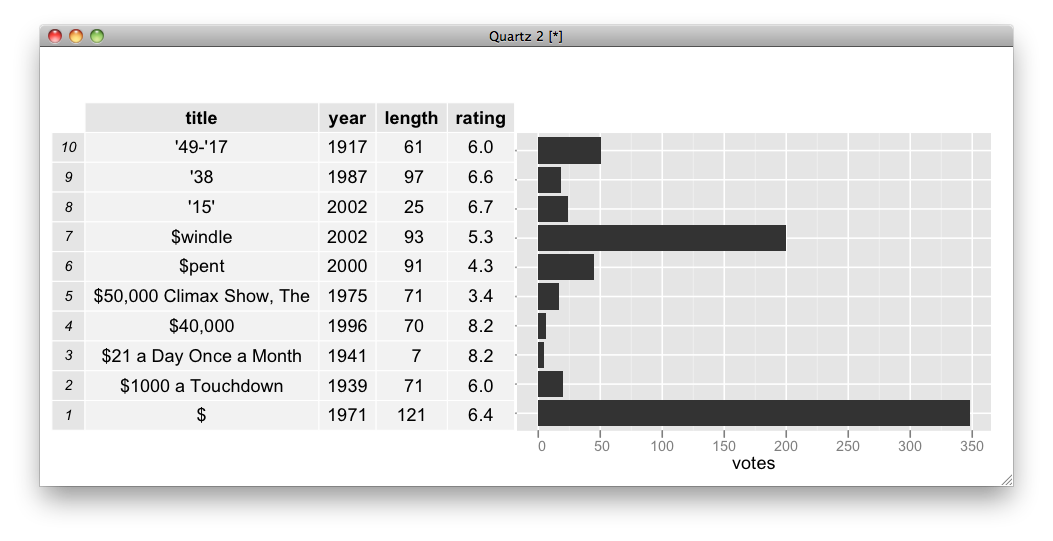
Maybe this if off-topic for off-topic, but I'm thinking about table axis.
Please find the attached picture. This was semi-manually done, though.
Probably I came across this feature request in SO or ggplot2 list.
The tableGrob in gridExtra is nice, but one request:
Is it possible to implement an interface for setting width/height of
each row/column?
Now the w/h is determined based on the contents. So it is not easy to
align the panel.
Just note that more general idea about guide-positional framework,
analogous to guide legend and guide colourbar:
input: positional information of breaks of main panel, and
supplementary information.
output: a grob aligned to the main panel.
Now there is only one guide-positional, i.e. guide-axis.
Other two guides are in my brain, guidep-table and guidep-marginal.
The attached picture represents gudip-table.
guidep-marginal will look like this:
http://stackoverflow.com/questions/8545035/scatterplot-with-marginal-histograms-in-ggplot2
But long afterward, anyway.
kohske
--
Kohske Takahashi <takahash...@gmail.com>
Research Center for Advanced Science and Technology,
The University of Tokyo, Japan.
http://www.fennel.rcast.u-tokyo.ac.jp/profilee_ktakahashi.html
2011/12/22 Bryan Hanson <han...@depauw.edu>:
> I'm attaching an example of what I was doing with the geom. This function (rxnNorm in HandyStuff on github.com/bryanhanson/HandyStuff) has had a fair amount of interest from ecology types and I've certainly made good use of it. So anything you can do that works toward this would be appreciated, keeping in mind that you have better things to do! Thanks, Bryan
>
>
>
>
baptiste auguie
> Hi,
>
> Maybe this if off-topic for off-topic, but I'm thinking about table axis.
> Please find the attached picture. This was semi-manually done, though.
> Probably I came across this feature request in SO or ggplot2 list.
>
> The tableGrob in gridExtra is nice, but one request:
> Is it possible to implement an interface for setting width/height of
> each row/column?
That should be easy and useful, I'll have a look. Also, I might try to
adapt the function for compatibility with the output of the new tables
package. One question, though: would gtables be a suitable framework
to produce tableGrob, should one want to rewrite it from scratch?
baptiste
PS: Would anyone have an example of a geom written for the new version
of ggplot2 that can be self-contained (not in a package)? I seem to
run into namespace issues now.
Hadley Wickham
Hadley
Sent from my iPhone
baptiste auguie
I've posted an example of geom_custom() on github,
https://gist.github.com/1513290
(I don't know how to give a link that can be source()d directly in R)
I get a strange warning, however,
"In get(x, envir = this, inherits = inh)(this, ...) :
"legend" argument in geom_XXX and stat_XXX is deprecated. Use
shou_guide = TRUE or show_guide = FALSE for display or suppress the
guide display."
Not sure what that means or where it comes from..
Hopefully that's still a useful replacement for the time being.
Baptiste
On 22 December 2011 14:27, Bryan Hanson <han...@depauw.edu> wrote:
> I'm attaching an example of what I was doing with the geom. This function (rxnNorm in HandyStuff on github.com/bryanhanson/HandyStuff) has had a fair amount of interest from ecology types and I've certainly made good use of it. So anything you can do that works toward this would be appreciated, keeping in mind that you have better things to do! Thanks, Bryan
>
>
>
>
> On Dec 21, 2011, at 8:17 PM, baptiste auguie wrote:
>
Kohske Takahashi
Please ignore the warning. It will be fixed.
But I could not run your example, probably due to namespace problem.
--
Kohske Takahashi <takahash...@gmail.com>
Research Center for Advanced Science and Technology,
The University of Tokyo, Japan.
http://www.fennel.rcast.u-tokyo.ac.jp/profilee_ktakahashi.html
2011/12/23 baptiste auguie <baptist...@googlemail.com>:
baptiste auguie
> Hi,
>
> Please ignore the warning. It will be fixed.
>
> But I could not run your example, probably due to namespace problem.
Strange, it works for me on a fresh R session. What error do you get?
sessionInfo()
R version 2.14.1 RC (2011-12-20 r57945)
Platform: i386-apple-darwin9.8.0/i386 (32-bit)
locale:
[1] en_GB.UTF-8/en_GB.UTF-8/en_GB.UTF-8/C/en_GB.UTF-8/en_GB.UTF-8
attached base packages:
[1] grid stats graphics grDevices utils datasets
methods base
other attached packages:
[1] gridExtra_0.7.1 png_0.1-4 proto_0.3-9.2 ggplot2_0.9.0
loaded via a namespace (and not attached):
[1] colorspace_1.1-0 dichromat_1.2-3 digest_0.5.1 MASS_7.3-16
[5] memoise_0.1 munsell_0.3 plyr_1.6 RColorBrewer_1.0-2
[9] reshape2_1.2 scales_0.1.0 stringr_0.6
Kohske Takahashi
Hadley Wickham
Note that there's a new geom_raster so you do the first one directly.
> (I don't know how to give a link that can be source()d directly in R)
This is an unfortunate conflict between R's lack of built in https
support, and Github's policy of only allowing https requests.