Problem with describe display
36 views
Skip to first unread message

Raphael Rath
Sep 10, 2014, 8:10:23 AM9/10/14
to gg...@googlegroups.com
Hi,
i have problems getting Ggobi plots into R. I saved an R file with Save Display Description and wanted to read the file into R using DescribeDisplay as explained in the book "Interactive and Dynamic Graphics for Data Analysis"
(I brushed some points in different colors before saving the file). Then i get the following error:
Error in (function (red, green, blue, alpha, names = NULL, maxColorValue = 1) :
Farbintensität 1.29372 nicht in [0, 1]
(the second line translates: Color intensity 1.29372 not in [0,1]
Thank you

Dianne Cook
Sep 10, 2014, 8:32:20 AM9/10/14
to Raphael Rath, gg...@googlegroups.com
Raphael,
Can you send me the GGobi saved plot file? I hopefully can work out what is wrong.
cheers,
Di
> --
> You received this message because you are subscribed to the Google Groups "GGobi users" group.
> To unsubscribe from this group and stop receiving emails from it, send an email to ggobi+un...@googlegroups.com.
> To post to this group, send email to gg...@googlegroups.com.
> Visit this group at http://groups.google.com/group/ggobi.
> For more options, visit https://groups.google.com/d/optout.
Can you send me the GGobi saved plot file? I hopefully can work out what is wrong.
cheers,
Di
> You received this message because you are subscribed to the Google Groups "GGobi users" group.
> To unsubscribe from this group and stop receiving emails from it, send an email to ggobi+un...@googlegroups.com.
> To post to this group, send email to gg...@googlegroups.com.
> Visit this group at http://groups.google.com/group/ggobi.
> For more options, visit https://groups.google.com/d/optout.
Dianne Cook
Sep 10, 2014, 10:12:45 AM9/10/14
to Raphael Rath, gg...@googlegroups.com
Raphael,
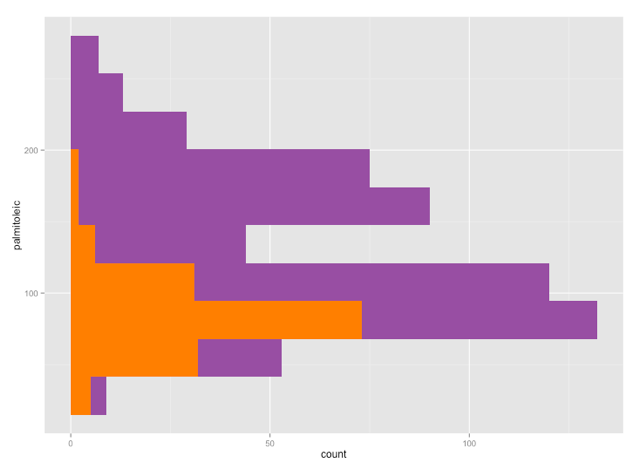
This was a gorgeous problem! The error occurred because ggobi saved numbers replacing decimal points “.” with the European standard “,”, and then also comma delimited the numbers. DescribeDisplay was quite confused! I manually change the commas into periods, to get valid values for the colors and the breaks, and then it all worked. The new ggobi output is attached. Is there any way for your computer to be told to use “.” instead of “,” for decimal places??
cheers,
Di
> d <- dd_load("/Users/dicook/Desktop/Histogramm.R")
> ggplot(d)
Reply all
Reply to author
Forward
0 new messages