NSIDC Reports 05.11.2009. The Seasonal Arctic Sea Ice Are Loss Hits a New Record Low (first time in 2009)

Veli Albert Kallio
RE: NSIDC: ARCTIC SEA ICE LOSS HITS 5th NOVEMBER NEW RECORD LOW
(FIRST TIME IN 2009) See the attached images and links.
NSIDC's latest sea ice area timeseries shows today the Arctic sea ice beating first time (on 5th November 2009) the previous 2007 all-time record lows of the area of the Arctic Ocean covered by the sea ice.
I am enclosing the links - and article below (which also refers to similar ideas that I was suggesting back 2007 and hinted at Terry Marsh - that the odd weather was the outcome of rapid sea ice area losses and surface darkening in the early to mid part of that summer, throwing the jet-streams and more intense strorms in a moderate but abrupt climate change fashion (rather than being a matter of a chance event of unusual coincidence of some extraordinary, low probability events coming together to produce storm intensities).
'Deviation' like the extremely hot summer in Europe that was many standard deviations away, suggested that there were shifts underplaying and deviations were non-standard.
I would like to draw attention to my views in summer 2007 when I had first-hand reports of the extremely strong electric storms and rainstorms on Greenland's Ice Dome while many areas of Britain saw its share of unusually intense rainfalls that were well-reported.
I suggested back then that the cause of the extremely strong UK rainfalls was the more southerly route of the jet streams. The cause of this, I suggested, was the rapid summer time disappearance of white snow covered ice and its fast replacement by dark surfaces.
The larger (and faster) the ocean surface darkening occurs in the summer season, the cold and dry polar air mass becomes fast expansionary: the warming air tending to expand upwards and outwards in a same fashion like warmed air inflates and lifts hot air balloons.
This volumetric 'expansion' of the dry polar air has then its margin pushed much further south than usually, this then encounters more easily with the tropical, humid air (due to steeper temperature gradient) between the two air masses from the pole and the equator.
The jet streams are then balanced or guided thus further south which then drives along depression systems where the two expansionary air masses (cold polar air mass and tropical) meet: the outcome of this being rainstorms, electric storms, flash floods and hail in places like South Greenland Ice Dome or Britain, well outside of the Arctic region.
In the autumn inflation goes to the reverse as the warming sunlight disappears, the collapsing air mass sucks in warm air more violently from the south than before.
As the sea ice area has been reduced, open sea surfaces grown in size, the waves grow bigger and penetrate deeper under the thinned and weaker seasonalized ice, breaking and mixing water with it more than before. The pack ice forms from thinned ice, the stronger winds collect ice over much wider areas (than thick multiyear ice) to make tall ice pile-ups.
The sea remains open more easily as the wind peels away fragile ice over much wider area.
The result of this is seen on the increase of evaporation in the autumns and winters when the Arctic air becomes more humid than previously due to open sea and more waves there. Thus, September 2007 record minimum sea ice area was soon followed by the record large snowfalls of February 2008 when the Northern Hemisphere snow area was the largest ever recorded reaching almost to the vicinity of the border of Vietnam at its peak.
The subtropical forests in China had hard hit of these, the forests North of Vietnamese border saw 60% of the trees dying and large biodiversity losses of smaller organisms, birds, lizards and frogs. that had less body mass to shelter away from the extreme cold there.
The cold escaping pulses from the Arctic during winters can become severe biodiversity killers and localised extinction events appear just like seen in Southern China in 2008. This increases the background rate of species extinction and well above replacement adding to other issues like deforestation, agriculture and urbanisation destroying natural habitats.
In my view of the satellite images 2008, much of this freezing air that had displaced and originated from the Arctic Ocean migrated over China and dumped its heat to northern parts of the Pacific Ocean: the cold weather intensifying sea water cooling and La Nina.
The cold pulses of air from China had a net positive effect on the Pacific coral reefs 2008.
While on the Arctic Ocean the effect of the thinning and sea ice area reduction manifested itself 2007 as more intense sea waves, producing the severe storm coastal erosion i.e. in Sismarnjef, Alaska, the sea ice too becomes more fractured and sea water more vertically mixed up at the surface layer. This year the "peel away" of thin ice is even more intense in the Atlantic end of the Arctic Ocean, although there are large ice-free area in the Bering Straights end, making a more intense bi-polar sea water exposed polar autumn this year.
I would think that the waves keep 'packing up' the thinned sea ice much more easily than it had in the previous winters and the larger sea ice free area therefore remains more resilient against the winter time sea ice freezing. In autumn and winter time Antarctica the surrounding sea currents and strong winds scatter ice north which speeds up ice growth.
Unfortunately, the supply of cold weather is not as plentiful in the Arctic and the sea ice creation this way will not work not nearly as easily in the Arctic than in Antarctica, where the winds from the continent and sea currents are colder. In that sense, Geographica mis-sstated me as an easy and reliable way to enhance sea ice growth in north. The suitable, extremely cold weather and cool water currents are not in good supply (at least not in this 2009 winter) to enhance significantly sea ice creation by ice break-up. (There are also couple other statements that omitted or were inaccurate what I had said.)
The extremely cold weather and sufficiently cool sea water are necessities of this to work. This technique according to its inventor FESCO (the Far Eastern Shipping Company) of Russia is called "ice chipping". In spring time ice is cut loose when warm winds blow ice towards warm sea area i.e. Amurskaya Bay area. The ship travels as close to coastal margin as deemed safe usually 25 metres deep to loosen the ice which then is carried in the spring to warm sea area where it melts away rapidly (sea ice demolition by ice-chipping). What Geographica attempted to refer was the autumn-time reverse: to break ice loose in extremely cold winds where water around it starts to re-freeze enhancing ice growth. But in lack of extreme cold winds and sufficiently cold ocean, it does not work (sea ice creation by ice-chipping). But we try to attempt this with Atmosmare Foundation.
It also must be said that the more motionary sea ice (as there are more ice free water due to the larger open sea ice area where wind can carry ice along unhindered means that ice keeps picking up more thermal inertia (heat) from the water it passes during its travels, the eddies around moving ice floes rising heat from just below surface and the windward high column and wave flushing pushing cold water from surface downwards.
Just like in February 2008 when Northern Asia had record large snow blanket and humidity, I suggest this to be the case in 2009/2010 summer. Similarly, the melt-away of the terrestrial snow cover in the Arctic is even more intense as the ground temperature has increased and when the first warm summer breezes hit Siberia, we will see similar record fast snow melt-away than in Yakutia in May 2008 due to warmer grounds.
Siberia's rivers are carrying about 35% more water than back in 1970s.
The 2009 has seen the weakest solar activity and radiative output perhaps for a century, this together with the past La Nina phase has suppressed some of these warming effects.
I may have (fortunately) disappointed those who I said that the Arctic Ocean would be ice free by 2009, but if my views of the more intense sea ice pile-up inhibits sea ice area recovery, we may be ready for the first ice-free conditions in summer 2010.
Boots and feedback welcome on the above ideas which I suggest is happening now.
But at least in 05.11.2009 we made so far one day record loss of sea ice area this year, lets see how the record low sea ice area in the Arctic Ocean continues from now on...
With kind regards,
Veli Albert Kallio, FRGS
Frozen Isthmuses Protection Campaign
of the Arctic and North Atlantic Oceans
Subject: Emailing: N_timeseries.png
Date: Fri, 6 Nov 2009 19:47:03 +0000
To: albert...@hotmail.com
<<N_timeseries.png>>
http://nsidc.org/data/seaice_index/images/daily_images/N_timeseries.png
November 3, 2009
Warm winds slow autumn ice growth
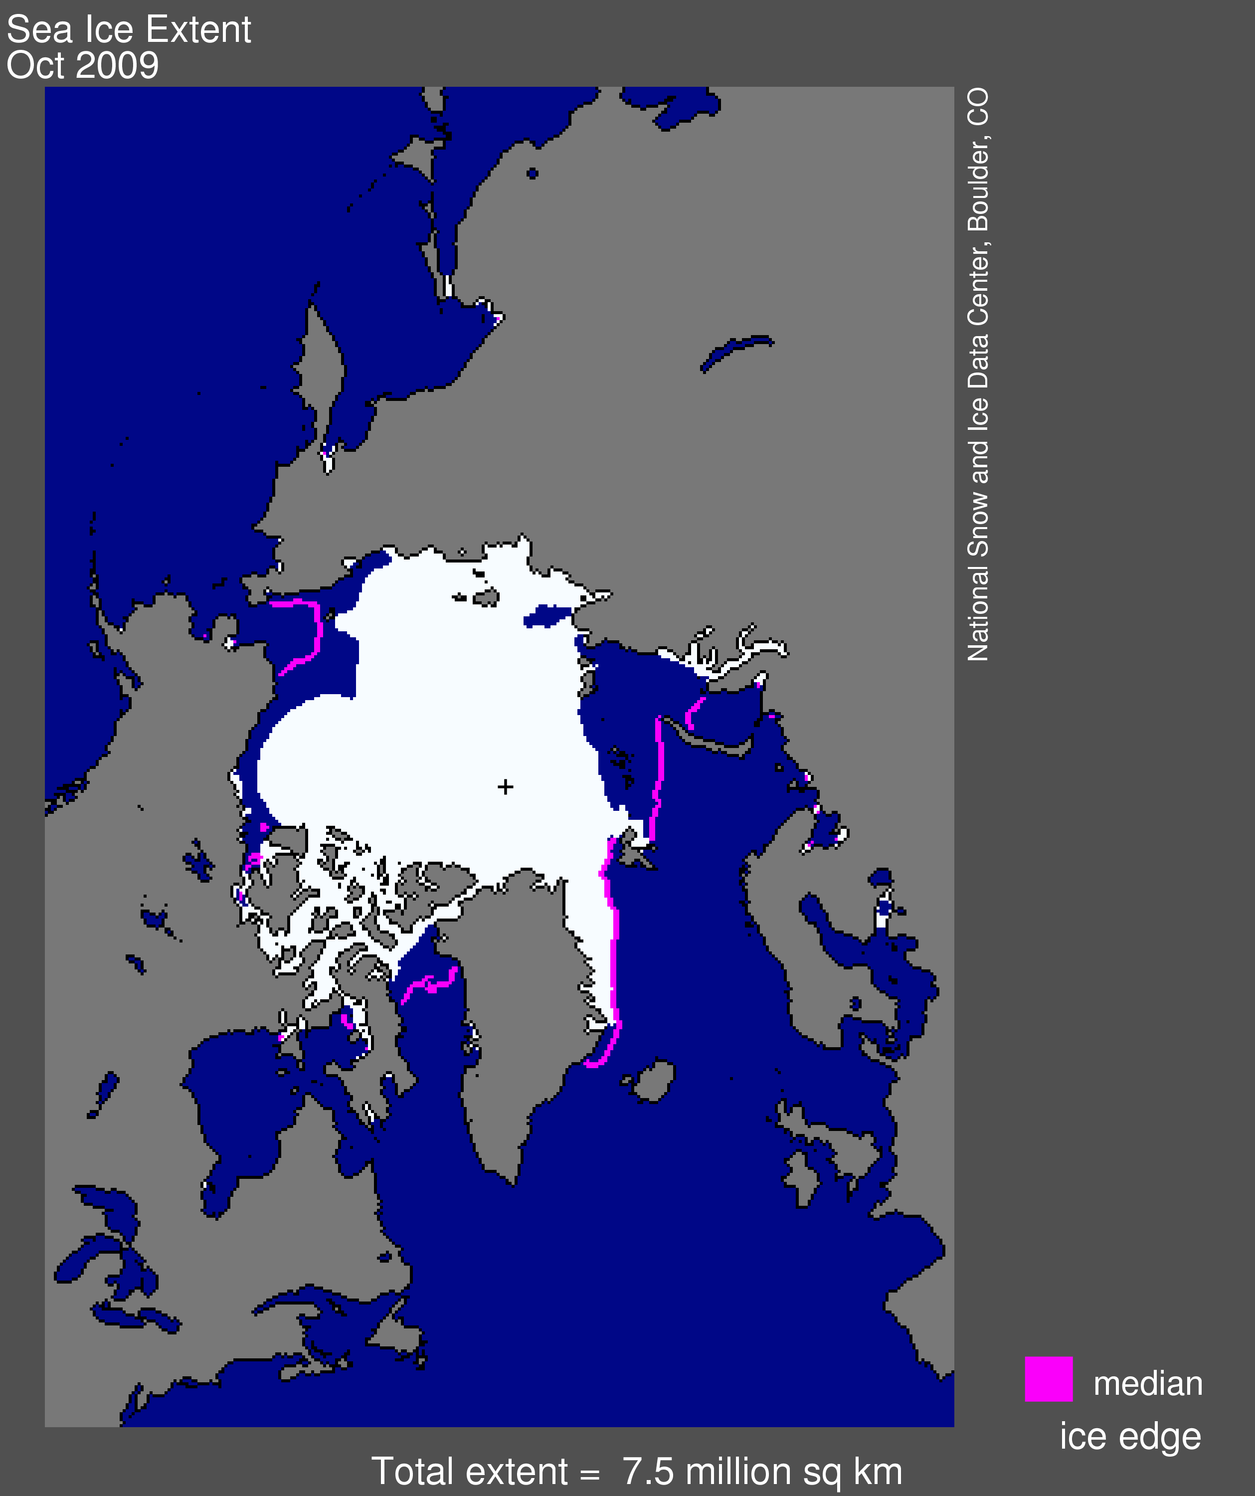
Sea ice extent grew throughout October, as the temperature dropped and darkness returned to the Arctic. However, a period of relatively slow ice growth early in the month kept the average ice extent low—October 2009 had the second-lowest ice extent for the month over the 1979 to 2009 period.
High-resolution image
Overview of conditions
Sea ice extent averaged over October 2009 was 7.50 square kilometers (2.90 square miles). This was 1.79 million square kilometers (691,000 square miles) below the 1979 to 2000 mean for October, but 730,000 square kilometers (282,000 square miles) above the record low for the month, which occurred in October 2007.
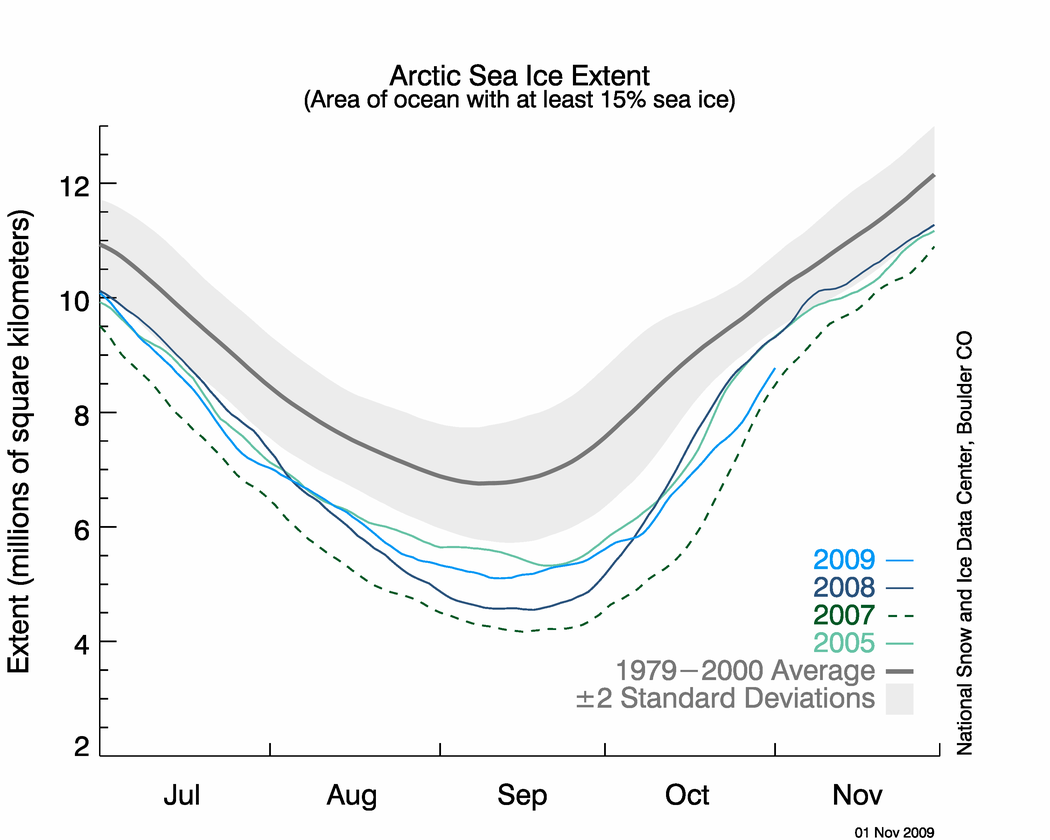 Figure 2. The graph above shows daily sea ice extent as of November 1, 2009. The solid light blue line indicates 2009; dark blue shows 2008, dashed green indicates 2007; light green shows 2005; and solid gray indicates average extent from 1979 to 2000. The gray area around the average line shows the two standard deviation range of the data. Sea Ice Index data.
—Credit: National Snow and Ice Data Center
High-resolution image
Conditions in context
In the fall, cold conditions and polar darkness return to the Arctic. As is typical for this time of year, ice growth was brisk in October, growing at an average 96,000 square kilometers per day (37,000 square miles per day).
However, the growth rate slowed for a time in early October, coinciding with strong winds from the south over central Siberia. The winds helped prevent ice from forming along the Siberian coast. At the end of the month, extensive areas of open water regions were still present in the northernmost North Atlantic, and north of Alaska. The ice edge was north of both Svalbard and Franz Josef Land.
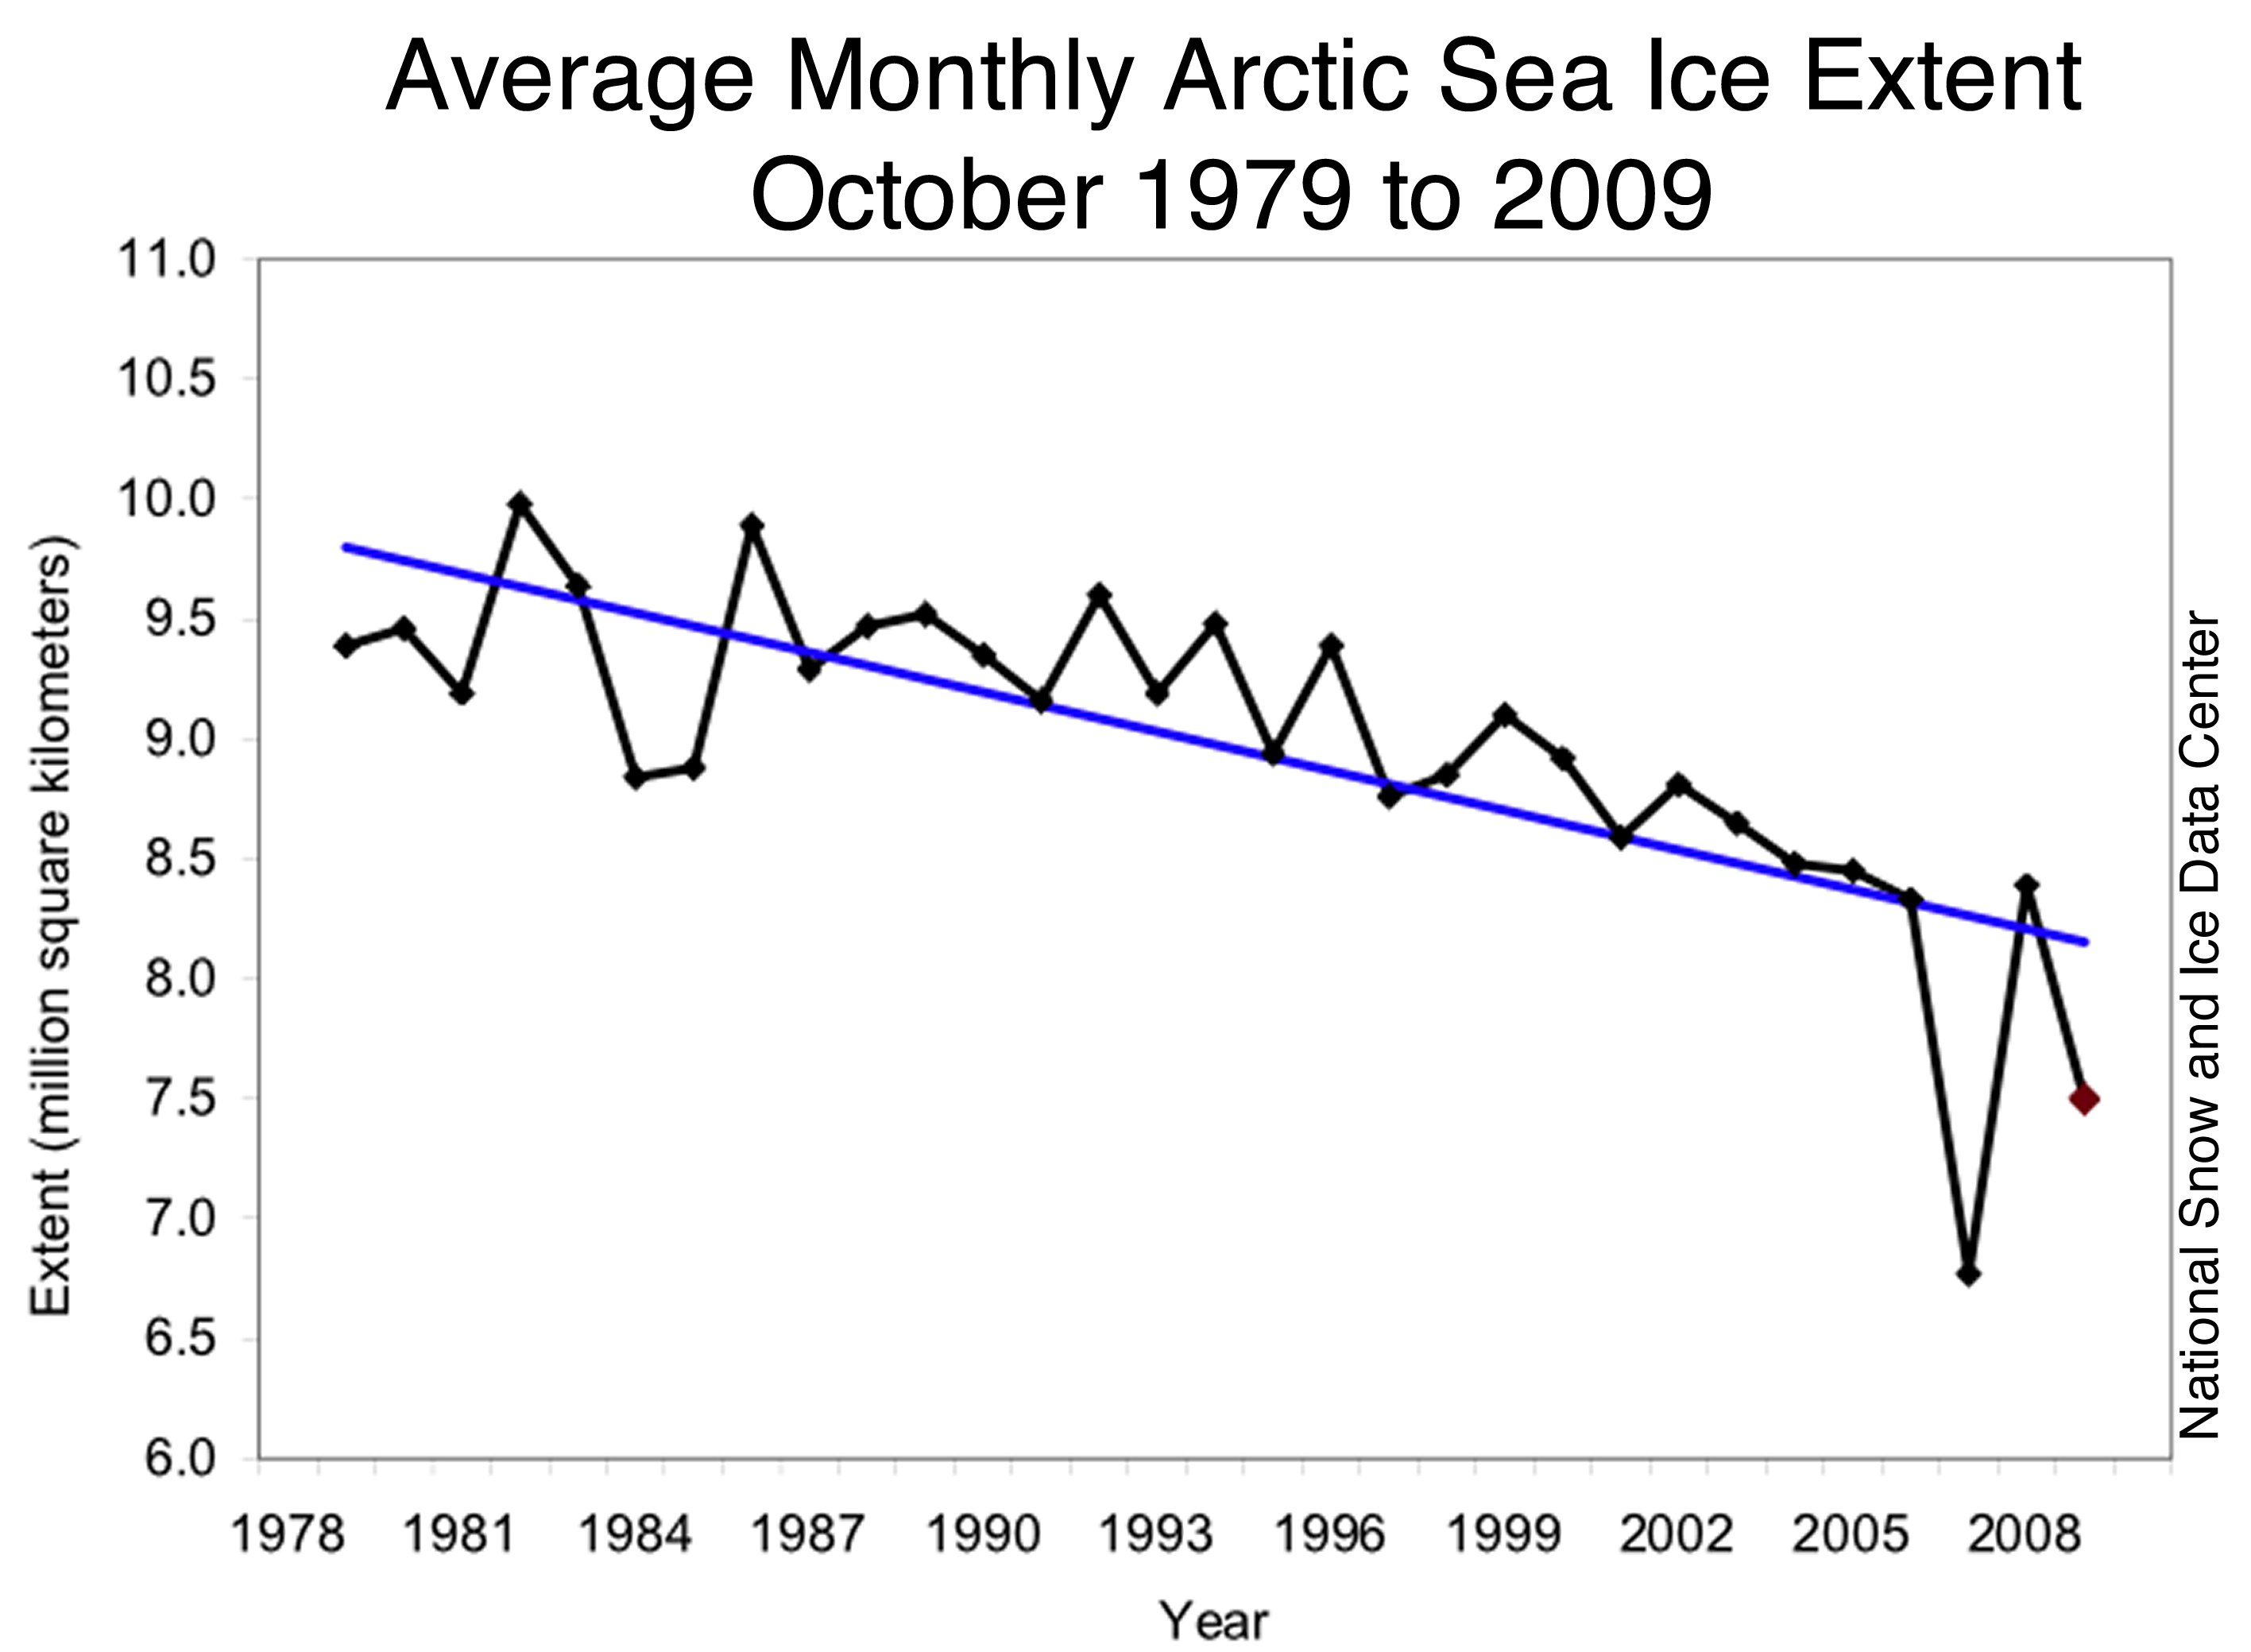 Figure 3. Monthly October ice extent for 1979 to 2009 shows a decline of 5.9% per decade.
 —Credit: National Snow and Ice Data Center
High-resolution image
October 2009 compared to past years
The period of slow ice growth at the beginning of the month helped to keep October average ice extent low. Arctic sea ice extent was 950,000 square kilometers (367,000 square miles) below October 2005 and 890,000 square kilometers (340,000 square miles) below that measured in 2008. Although ice extent for October 2009 was 730,000 square kilometers (282,000 square miles) above the record low for the month in 2007, it steepened the linear trend for October slightly to -5.9 % per decade.
High-resolution image
A warm October
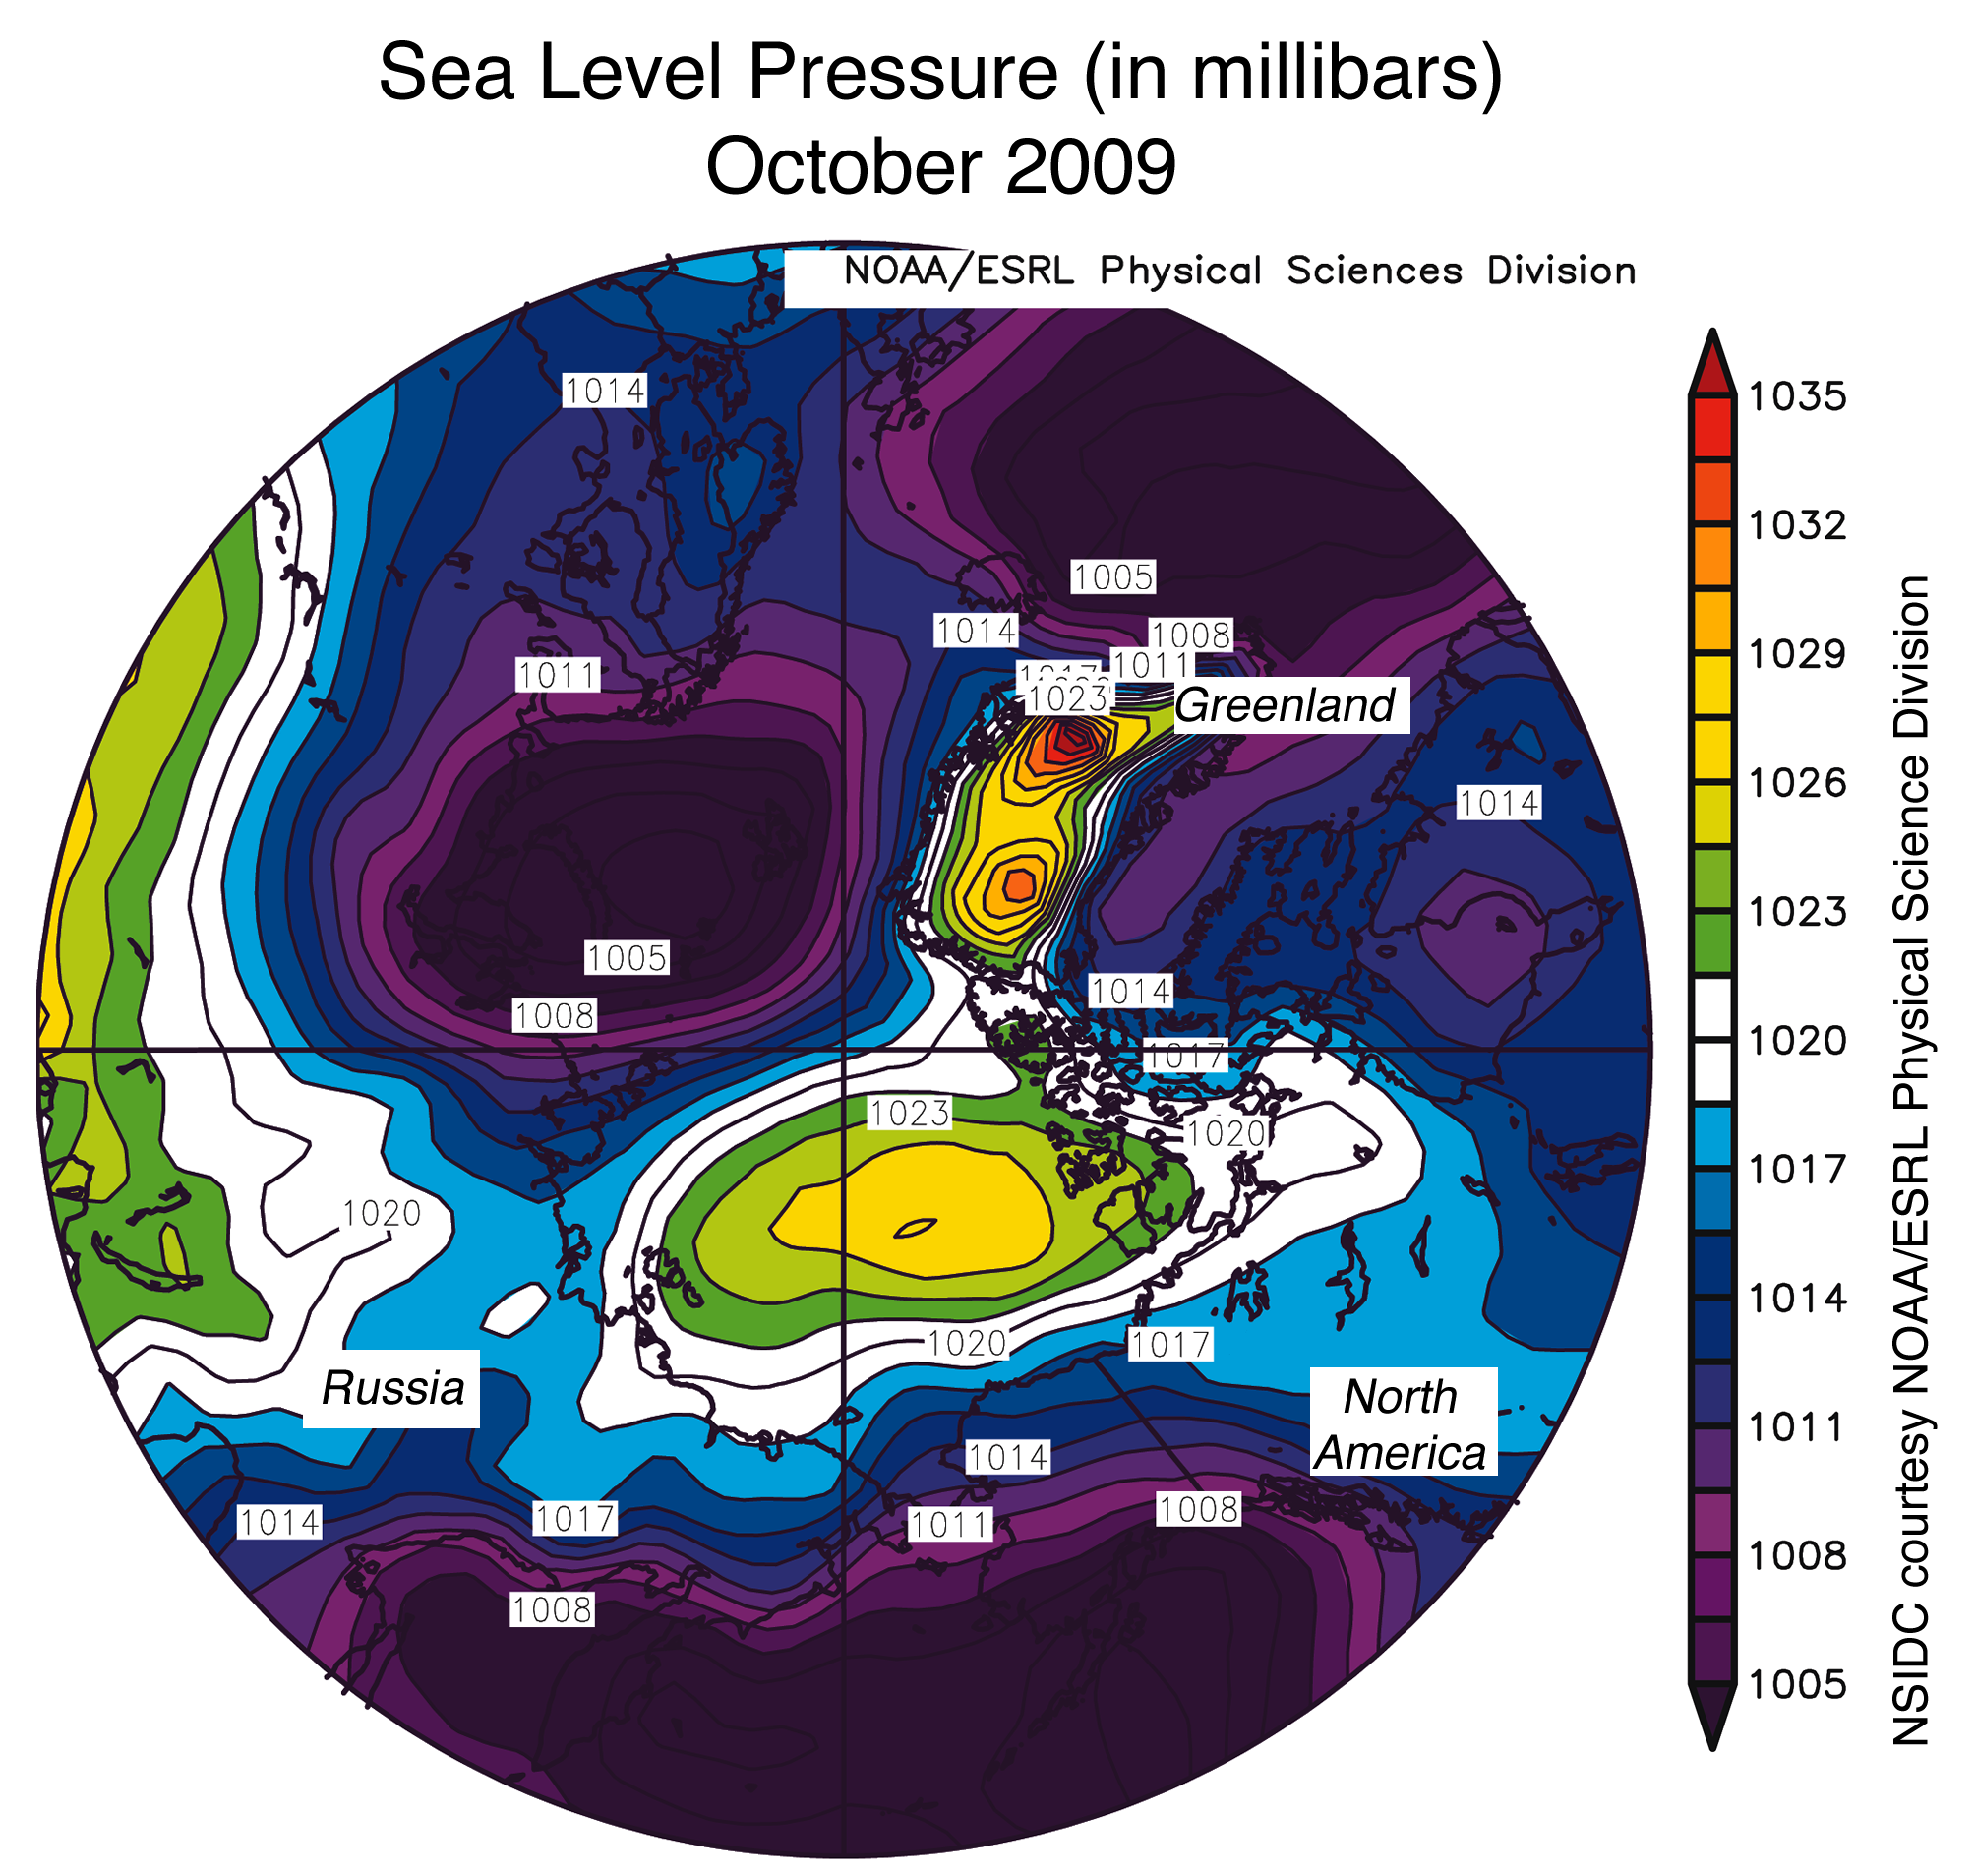
For most of the month, a high-pressure system sat over the Beaufort Sea, while unusually low pressure dominated the Barents Sea. In accord with Buys Ballot's Law, the area between the two pressure centers saw strong, warm winds blowing from the south. This wind pattern, in conjunction with extensive open water, led to a mean monthly temperature as high as 6 degrees Celsius (11 degrees Fahrenheit) above average in the region between the high and low pressure anomalies (October air temperature map).
—Credit: National Snow and Ice Data Center
High-resolution image
Declining sea ice extent and Arctic storms
A new study by Ian Simmonds and Kevin Keay, at the University of Melbourne in Australia, finds connections between the decline in September sea ice extent and the characteristics of Arctic storms. As ice extent has decreased, Arctic storms have shown a tendency to become more intense, especially in the last few years. The study suggests that low September ice extent, with extensive areas of open water, provides more energy to autumn storms, allowing them to become stronger. The stronger storms also help to break up the ice.
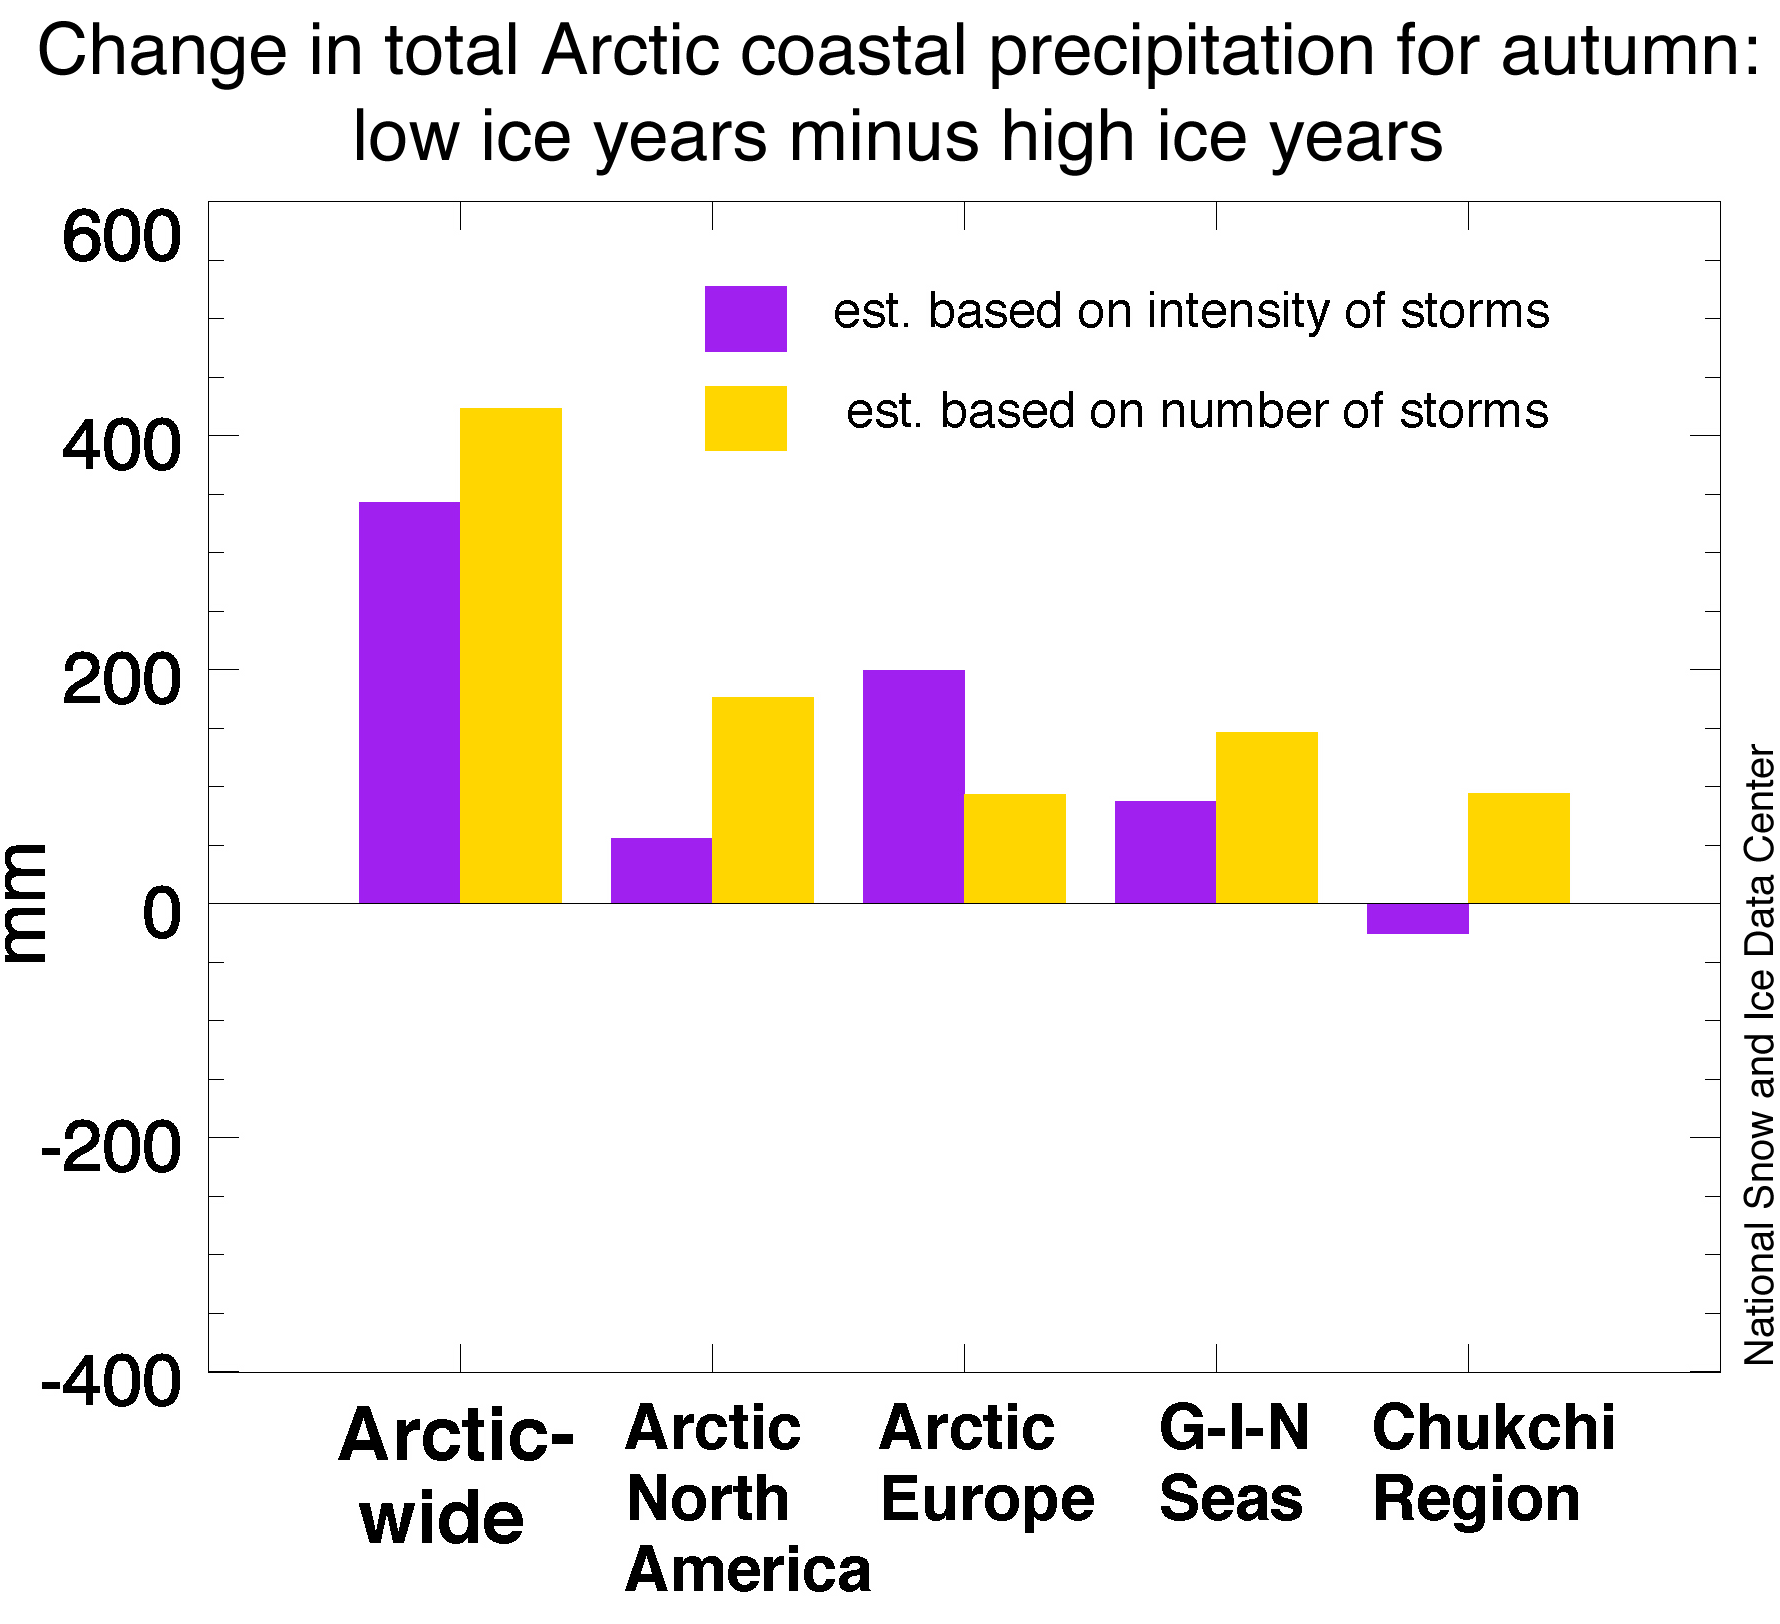
Related research at NSIDC reveals that when September ice extent is unusually low, precipitation linked to Arctic storms tends to be greater than when September ice extent is unusually high (Figure 5). Climate scientists are interested in these studies, because increased autumn snowfall could have effects on both sea ice and permafrost in the Arctic.
References
Simmonds, I., and K. Keay. 2009. Extraordinary September Arctic sea ice reductions and their relationships with storm behavior over 1979–2008, Geophys. Res. Lett., 36, L19715, doi:10.1029/2009GL039810.
![]() NSIDC scientists provide Arctic Sea Ice News & Analysis, with partial support from NASA.
NSIDC scientists provide Arctic Sea Ice News & Analysis, with partial support from NASA.
New Windows 7: Simplify what you do everyday. Find the right PC for you.