Calculating the effective sample size
2,504 views
Skip to first unread message

Jujiao Kang
Feb 16, 2022, 6:43:35 AM2/16/22
to Genomic SEM Users
Dear all,
I have several questions about calculating the effective sample size (Neff).
1. According to the the chain initiated by Lucy (https://groups.google.com/g/genomic-sem-users/c/VTBe0vLqmnU/m/DGODqH-VBQAJ), we have the equation SE = 1/sqrt(sum(eff_N/4)*MAF*(1-MAF)). According to Mallard et. al (https://doi.org/10.1101/603134), SE = 1/sqrt(sum(eff_N)*2*MAF*(1-MAF)). The two equations are different. I am wondering how is the equation SE = 1/sqrt(sum(eff_N/4)*MAF*(1-MAF)) is derived.
2. Here are several other equations can be used to estimate the Neff. First, according to wiki, Neff=4*v*(1-v). Second, according to Zhu et. al. (https://doi.org/10.1038/ng.3538),
SE = 1/sqrt((Neff+Z^2)*2*MAF*(1-MAF)). I am wondering which one should be used in the Genomic SEM.
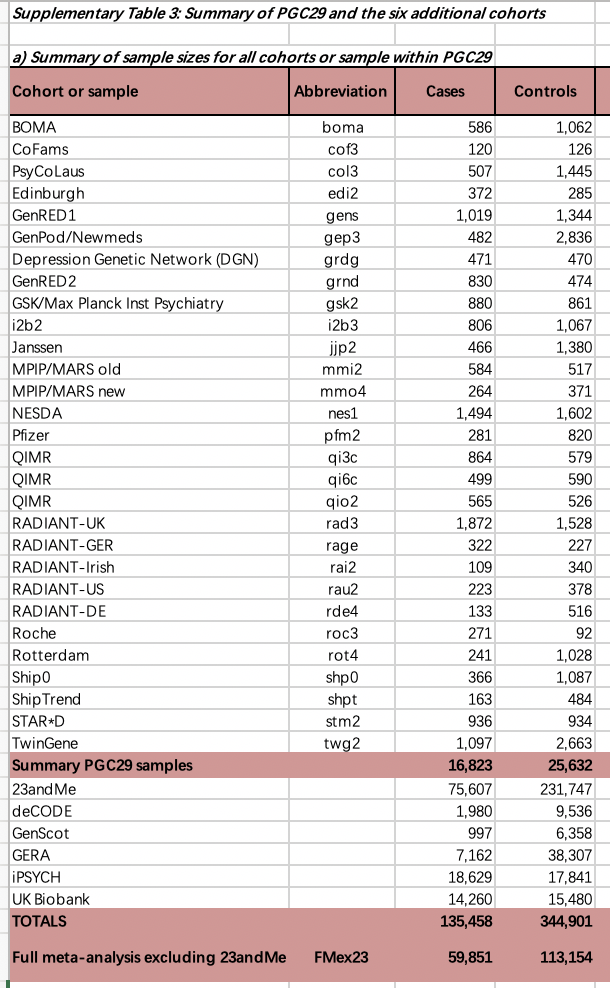
3. I tried to calculate the Neff of GWASs used in Grotzinger et. al. (https://doi.org/10.1101/2021.09.22.21263909). However, I can not get the correct results. As shown in the following picture, the Neff of AN GWAS is 34,467, but the Neff in the summary statistics is 46321.9.

Also, the Neff of OCD GWAS is 5712, but the summed Neff of 7 cohorts (displayed in the following picture) is Neff=sum(4*v_k*(1-v_k)*n_k)=7281.
I also tried other equations above, but no one is correct. I am wondering how does the Neffs in above picture are calculated.

Acturally, the Neff in the summary statistics of MDD GWAS is 69115, but the Neff of cohorts (displayed in the picture) is 137,301.
It seems that different GWAS use different methods to calculate Neff. I am wondering which equation should be used in Genomic SEM. Would you please share the code of the preprint (https://doi.org/10.1101/2021.09.22.21263909) to me.
4. By the way, I used the latest anxiety GWAS (10.1001/jamapsychiatry.2019.1119) and several GWASs (available in PGC website) to obtain the genetic correlation matirx. The GCs are beyond 1 (range: 1.2~3.7). I assume the genetic correlation is close to [-1,1]. What happened here?
Thank you very much.
Best,
Jujiao
Jujiao Kang
Feb 17, 2022, 1:17:42 AM2/17/22
to Genomic SEM Users
Sorry, the doi of Grotzinger et. al. is https://doi.org/10.1101/2020.09.22.20196089

Elliot Tucker-Drob
Feb 17, 2022, 9:11:13 AM2/17/22
to Jujiao Kang, Genomic SEM Users
Hi Jujiao,
Elliot
1 and 2. You've picked up on two different uses of the term Effective N, and I agree that this is confusing. One version (4v(1-v)n) is used to convert the reported Ns for different binary GWAS to be comparable to one another by converting each to the equivalently-powdered sample size corresponding to a a balanced (50% cases, 50% controls) design. We present the derivation of this in the appendix to the "pervasive downward bias" paper by Grotzinger et al., but the formula has been known for some time. There are also some mathematically equivalent versions of the equation that are out there (see, e.g. https://groups.google.com/g/ldsc_users/c/yJT-_qSh_44/m/MmKKJYsBAwAJ). The other version (provided in the Mallard supplement; also see section 4.4 of Florian Prive's preprint here: https://doi.org/10.1101/2021.03.29.437510) is a way to impute the N from the standard errors of the regression coefficients. This can be done for both binary and continuous GWAS, but the equations differ a bit. To avoid confusion moving forward, we will start to refer to this second type as expected N, or N_hat. We have edited the "Calculating sample size for factors" section on the 4thpage of the Genomic SEM wiki (https://github.com/GenomicSEM/GenomicSEM/wiki/4.-Common-Factor-GWAS) to reflect this change. Calculating sum of effective N as described in the Grotzinger paper refers to effective N and not N_hat. This is made explicit in the Grotzinger paper. The derivation is in the supplement. The beginning of that supplement also provides basic formulae for SEs of continuous and logistic betas.
3. It seems from your follow-up email that you are trying to compute the EffNs for the GWAS sumstats used in the Grotzinger "11 disorders" preprint, and not the Grotzigner "Pervasive downward bias" preprint. Note that the "11 disorders" preprint was posted some time before the "Pervasive downward bias" preprint and therefore did not implement the newly introduced sum(EffN) method. Also note that the "11 disorders paper may have used some versions of the summary statistics that are not publicly accessible (e.g. 23&me sumstats, which requires a separate agreement with 23&me). If you are trying to verify how sum(EffN) is derived, I would therefore encourage you to try to reproduce the calculations in the "Pervasive downward bias paper." I understand that some groups will sometimes report EffN/2 in their sumstats EffN column. So, just like with other aspects of verifying sumstats (e.g. making sure that the SE's reported are for the logistic betas, and not ORs as is sometimes the case) you'll want to pay close attention to what you are working with and implement some QC steps to be sure. I can't follow from your email exactly where each discrepancy that you flag is coming from, but I believe that the above advice should help you figure out what's going on. With regards to what formula to use: I don't think there is any ambiguity with respect to the formula that we recommend (and have validated analytically and with simulation) in the "Pervasive downward bias" paper, or how it should be implemented, so I suggest taking a close read of that.
4. Genetic correlation estimates within LDSC are not bounded at -1,1. Because they may be estimated imprecisely when N is small and/or heritability is low, they can sometimes go out of bounds. This is well known. We provide a smoothing procedure within Genomic SEM to ensure that matrices are positive definite, which includes warnings when extensive smoothing is needed.
All the best,
Elliot
--
You received this message because you are subscribed to the Google Groups "Genomic SEM Users" group.
To unsubscribe from this group and stop receiving emails from it, send an email to genomic-sem-us...@googlegroups.com.
To view this discussion on the web visit https://groups.google.com/d/msgid/genomic-sem-users/4db03bfd-c34b-4941-ad5a-256b48890cb5n%40googlegroups.com.
Jujiao Kang
Feb 20, 2022, 7:28:41 AM2/20/22
to Genomic SEM Users
Hi Elliot,
Thank you very much for your detailed response, now I have a better understanding of how to calculate the effective sample size. I will peruse the "Pervasive downward bias" paper.
Best wishes,
Jujiao

Dan
May 2, 2023, 5:30:08 AM5/2/23
to Genomic SEM Users
Hi,
I am new to Genomic SEM and also trying to replicate the analysis in Grotzinger et al (https://www.nature.com/articles/s41588-022-01057-4). I understand the differences reg the sample sizes. I was wondering whether the script for this paper is available.
Best wishes,
Dan

agro...@gmail.com
May 16, 2023, 9:23:33 PM5/16/23
to Genomic SEM Users
Hi Dan,
This hasn't been made available anywhere and I'm attaching here the code to run the models. As you highlighted, a number of differences are to be expected with the datasets you are using, including the fact that we meta-analyzed five traits (ADHD, MDD, PTSD, ALCH, ANX) within Genomic SEM and that we use restricted access data (e.g., from 23andMe).
Best,
Andrew
Reply all
Reply to author
Forward
0 new messages