Questions About the GISTIC2 Module output amp plot file
54 views
Skip to first unread message

Jihong Tang
Sep 5, 2022, 11:34:56 PM9/5/22
to GenePattern Help Forum
Hi,
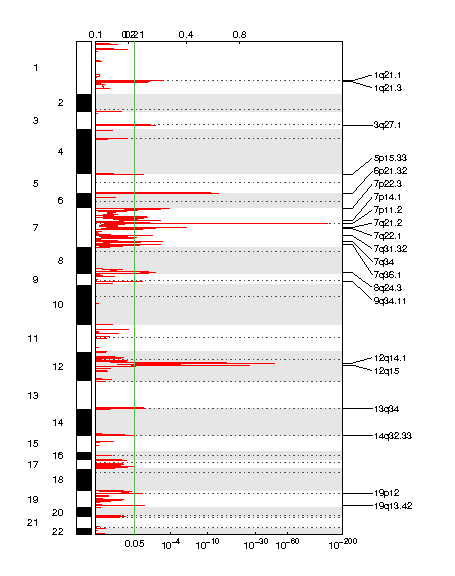
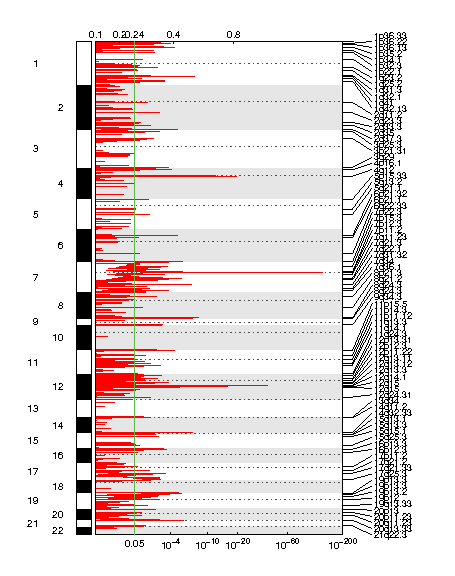
I have some questions about the output file of the GISTIC2 Module. I used the GISTIC2 module offline and will get the amp_qplot.pdf and del_qplot.pdf files among the outputs. When I check the results for different cnv analysis jobs, I found that the display of the chromosome regions in different amp_qplot.pdf is different. As attached, the length of the two chr2 black blocks is different in two different analysis jobs. Therefore, I am wondering how the display style of the region of the chromosomes is determined. Are there any parameters that can control the display style? In other words, if I would like to make the display of the chromosome regions the same among different jobs, how can I achieve that?
Thank you so much in advance for any suggestions and help!!!
Bests,
Jihong
Jihong

Ted Liefeld
Sep 6, 2022, 1:38:32 PM9/6/22
to GenePattern Help Forum
For a question like this its best to consult the GISTIC forum (https://groups.google.com/a/broadinstitute.org/g/gistic-forum) where the authors and developers of GISTIC can respond.
Hope this helps,
Ted
Jihong Tang
Sep 6, 2022, 10:17:57 PM9/6/22
to genepatt...@googlegroups.com
Hi
Thank you for the instructions.
Best
Jihong
--
You received this message because you are subscribed to a topic in the Google Groups "GenePattern Help Forum" group.
To unsubscribe from this topic, visit https://groups.google.com/d/topic/genepattern-help/ykxsWUZ7B-g/unsubscribe.
To unsubscribe from this group and all its topics, send an email to genepattern-he...@googlegroups.com.
To view this discussion on the web visit https://groups.google.com/d/msgid/genepattern-help/a1daf410-381b-4dfe-94e4-0e4d6e60b2f4n%40googlegroups.com.
Reply all
Reply to author
Forward
0 new messages