eQTLs lack color
15 views
Skip to first unread message

Minoli Perera
Mar 21, 2023, 6:20:56 PM3/21/23
to FUMA GWAS users
In the results files from my FUMA analysis, none of the eQTLs are colored by tissues.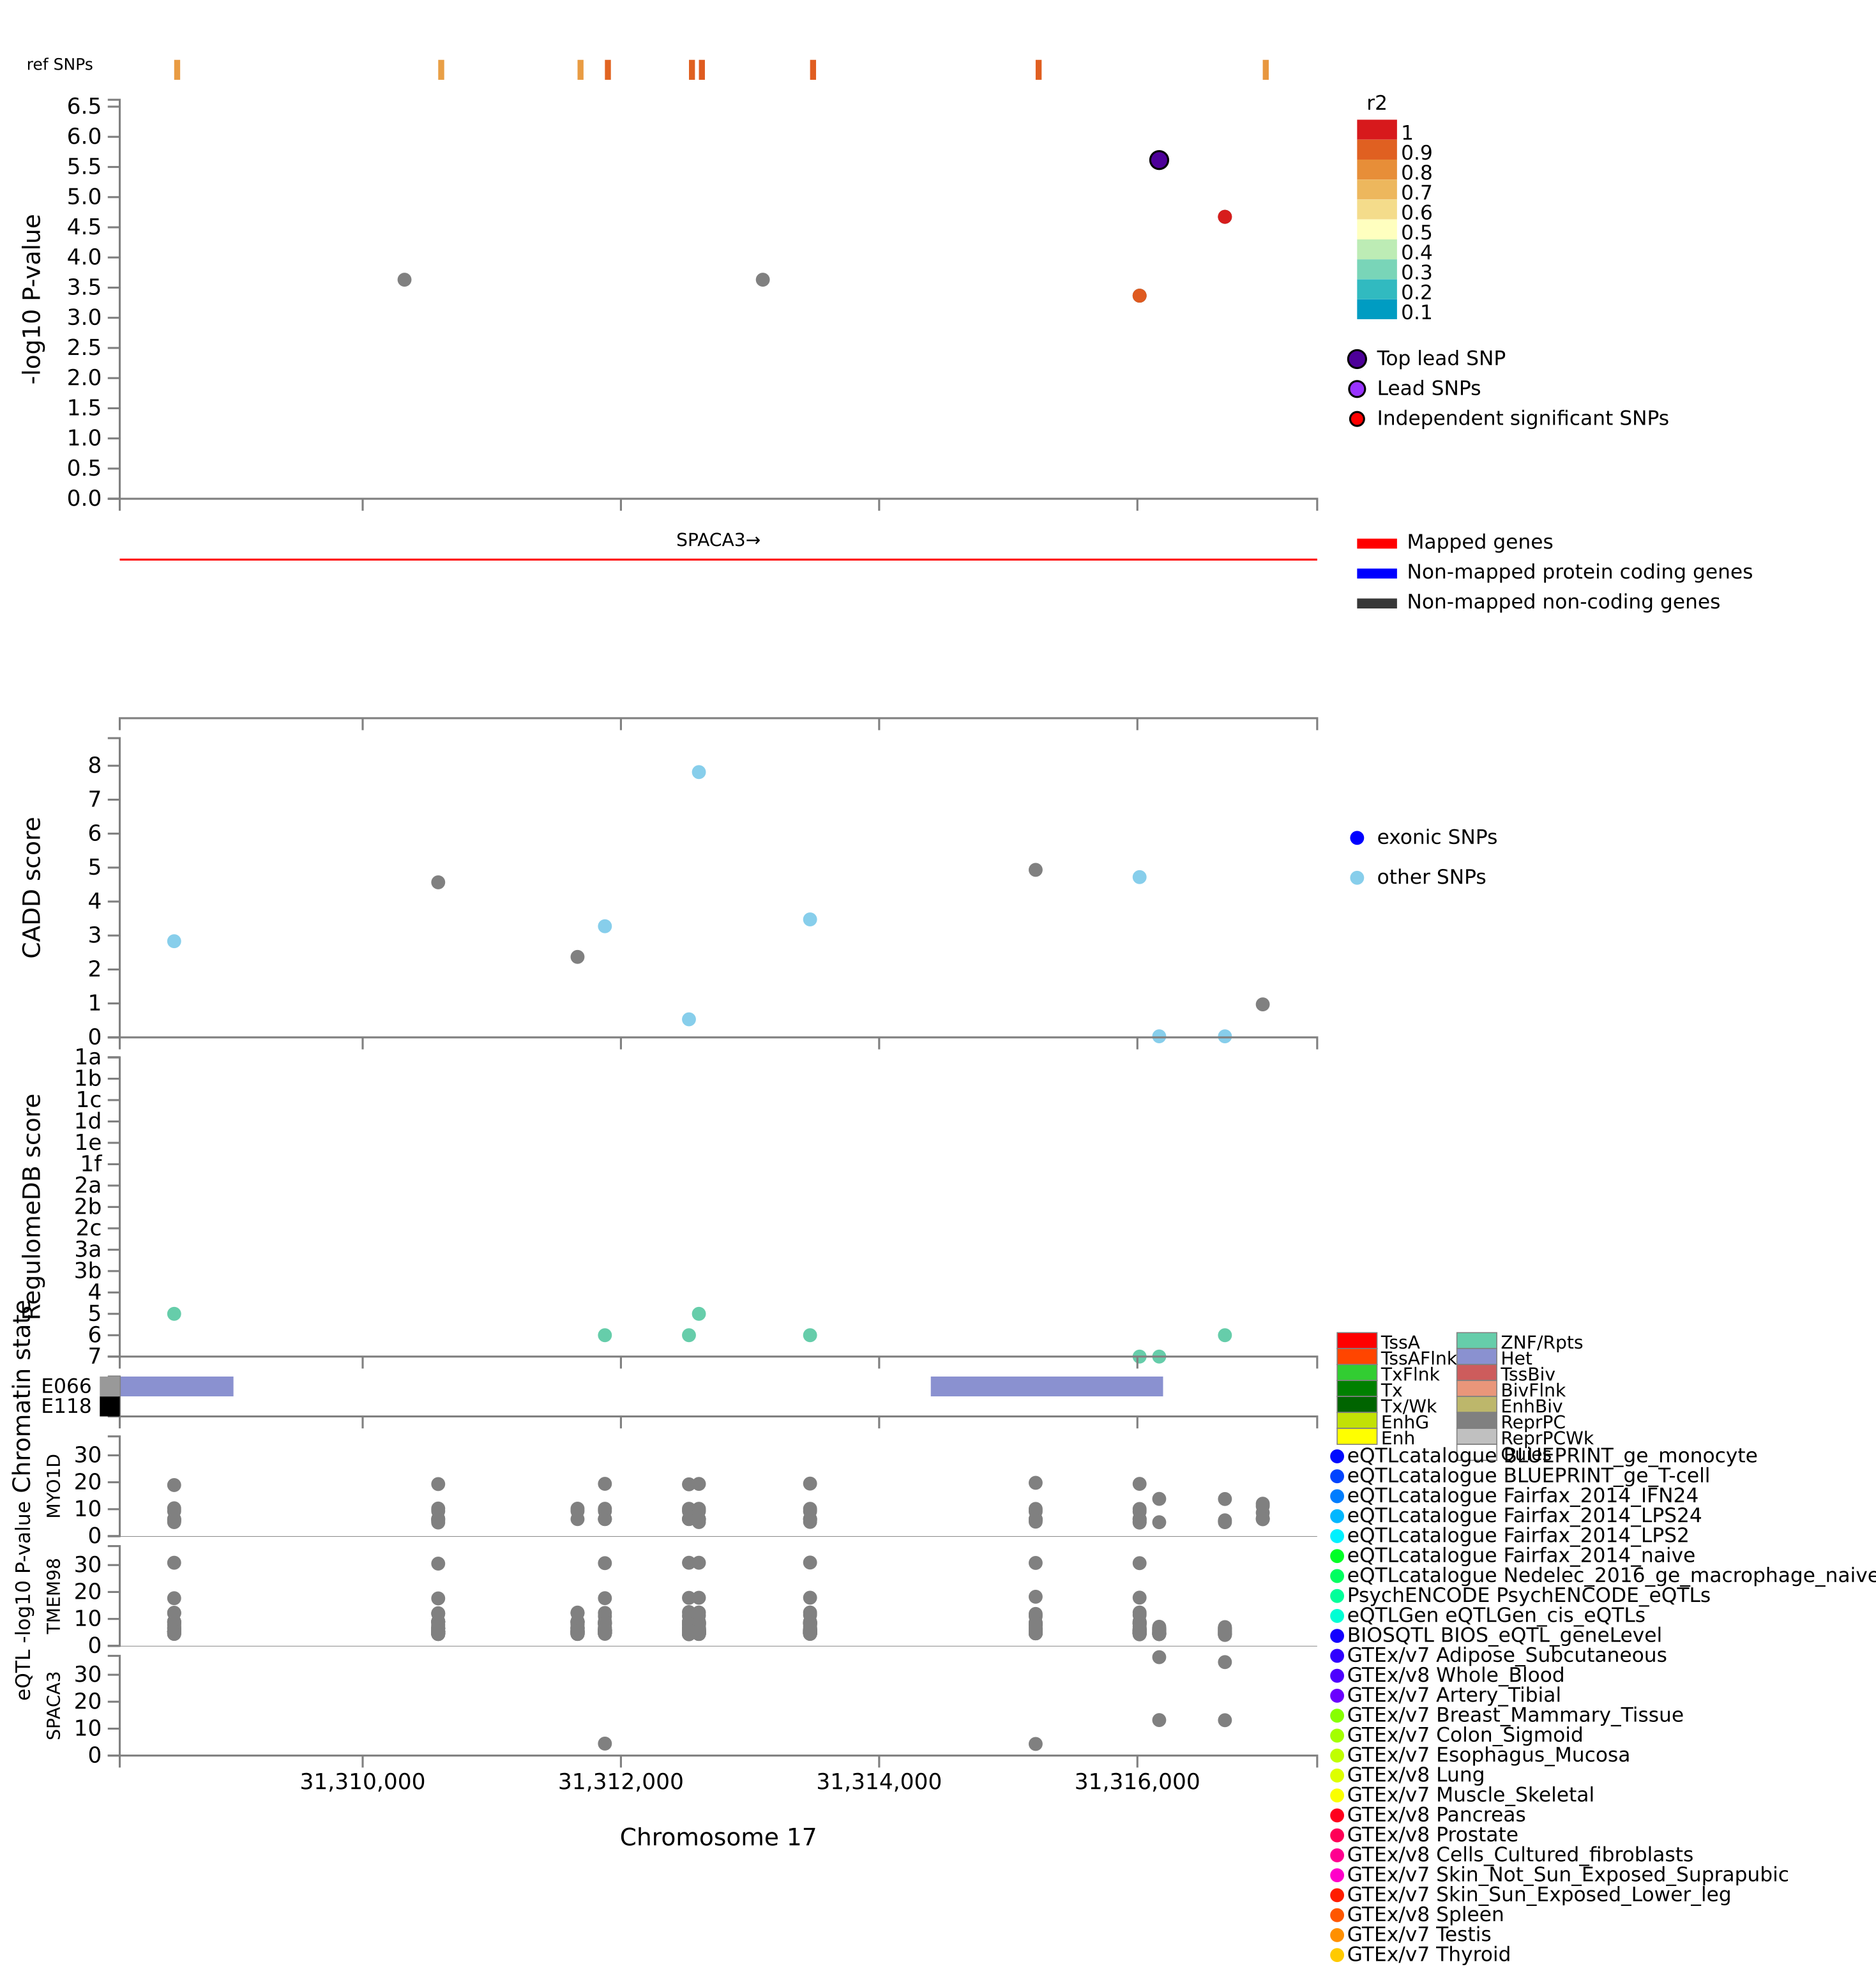

Tanya Phung
Mar 22, 2023, 4:53:01 AM3/22/23
to FUMA GWAS users
Dear Minoli,
Thank you for using FUMA and for your message.
When viewing the plots, if you scroll down there is a message explaining why the colors are gray:
I hope this helps,
Tanya
Thank you for using FUMA and for your message.
When viewing the plots, if you scroll down there is a message explaining why the colors are gray:
eQTLs: When eQTL mapping was performed and if there is any eQTL in the selected region, all eQTLs with user defined P-value threshold and tissue types are displayed. Of those eQTLs, eQTLs which did not used for eQTL mapping (eQTLs that were filtered by user defined parameters) are colored grey.
I hope this helps,
Tanya
Minoli Perera
Mar 23, 2023, 10:53:15 AM3/23/23
to FUMA GWAS users
thanks so much! that makes sense.
Reply all
Reply to author
Forward
0 new messages