Flutter DevTools 2.6.0 Release Notes

Kenzie (Schmoll) Davisson
Flutter DevTools 2.6.0 Release Notes
Dart & Flutter DevTools - A Suite of Performance Tools for Dart and Flutter
NOTE: This announcement contains features from DevTools releases 2.5.0 and 2.6.0. The latest DevTools, 2.6.0, is now available with the Flutter 2.5 stable release.
Inspector Updates
Added hover-evaluation support for widgets in the inspector. Hover over a widget to evaluate the object, view properties, widget state, etc.
Added hover-evaluation support for widgets in the inspector. Hover over a widget to evaluate the object, view properties, widget state, etc.
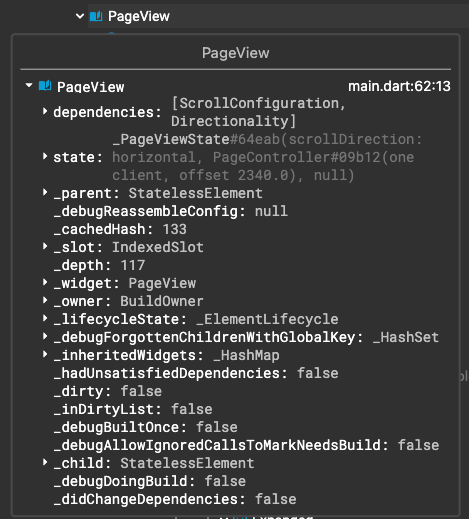
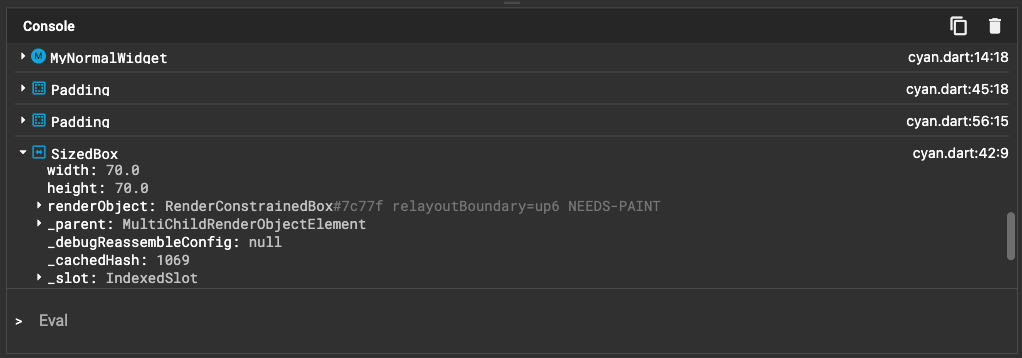
Added a console with evaluation support to the inspector. When you select a widget in the inspector widget tree, the object you selected will automatically populate in the console below, where you can explore the object and its properties. When paused at a breakpoint, you can also evaluate expressions from this console.
Added descriptive icons and colors for widgets in the widget tree
Added text previews for text widgets

UX improvements to icons and coloring for visual debugging actions.
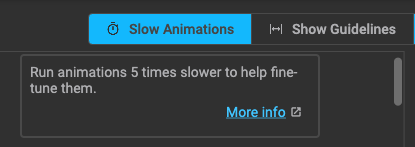
Added rich tooltips to visual debugging actions that provide a more detailed explanation of their functionality as well as a link to documentation to learn more.
Performance Updates
Rebuilt the Flutter Frames chart to be “live”, so that frames are populated in this chart as they are rendered in your app. Selecting a frame from this chart will navigate to, and possibly load, the timeline events for that frame.
Rebuilt the Flutter Frames chart to be “live”, so that frames are populated in this chart as they are rendered in your app. Selecting a frame from this chart will navigate to, and possibly load, the timeline events for that frame.

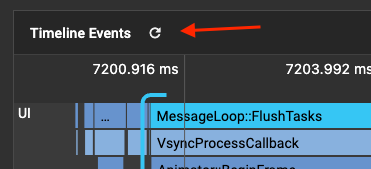
You can manually refresh the timeline events in the timeline event chart by clicking the “Refresh timeline events” button:
CPU Profiler Updates
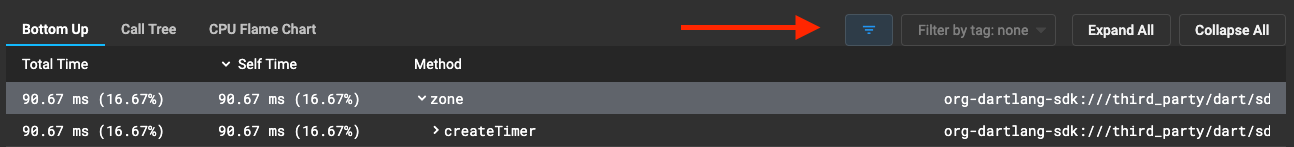
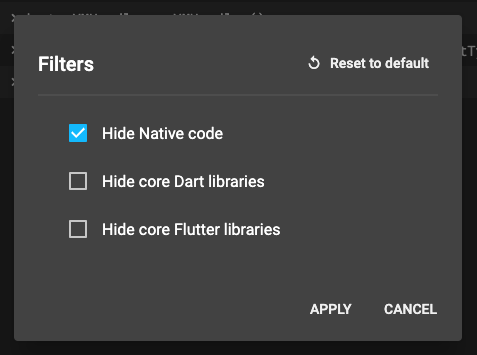
Support filtering for CPU profiles - #3236
Support filtering for CPU profiles - #3236
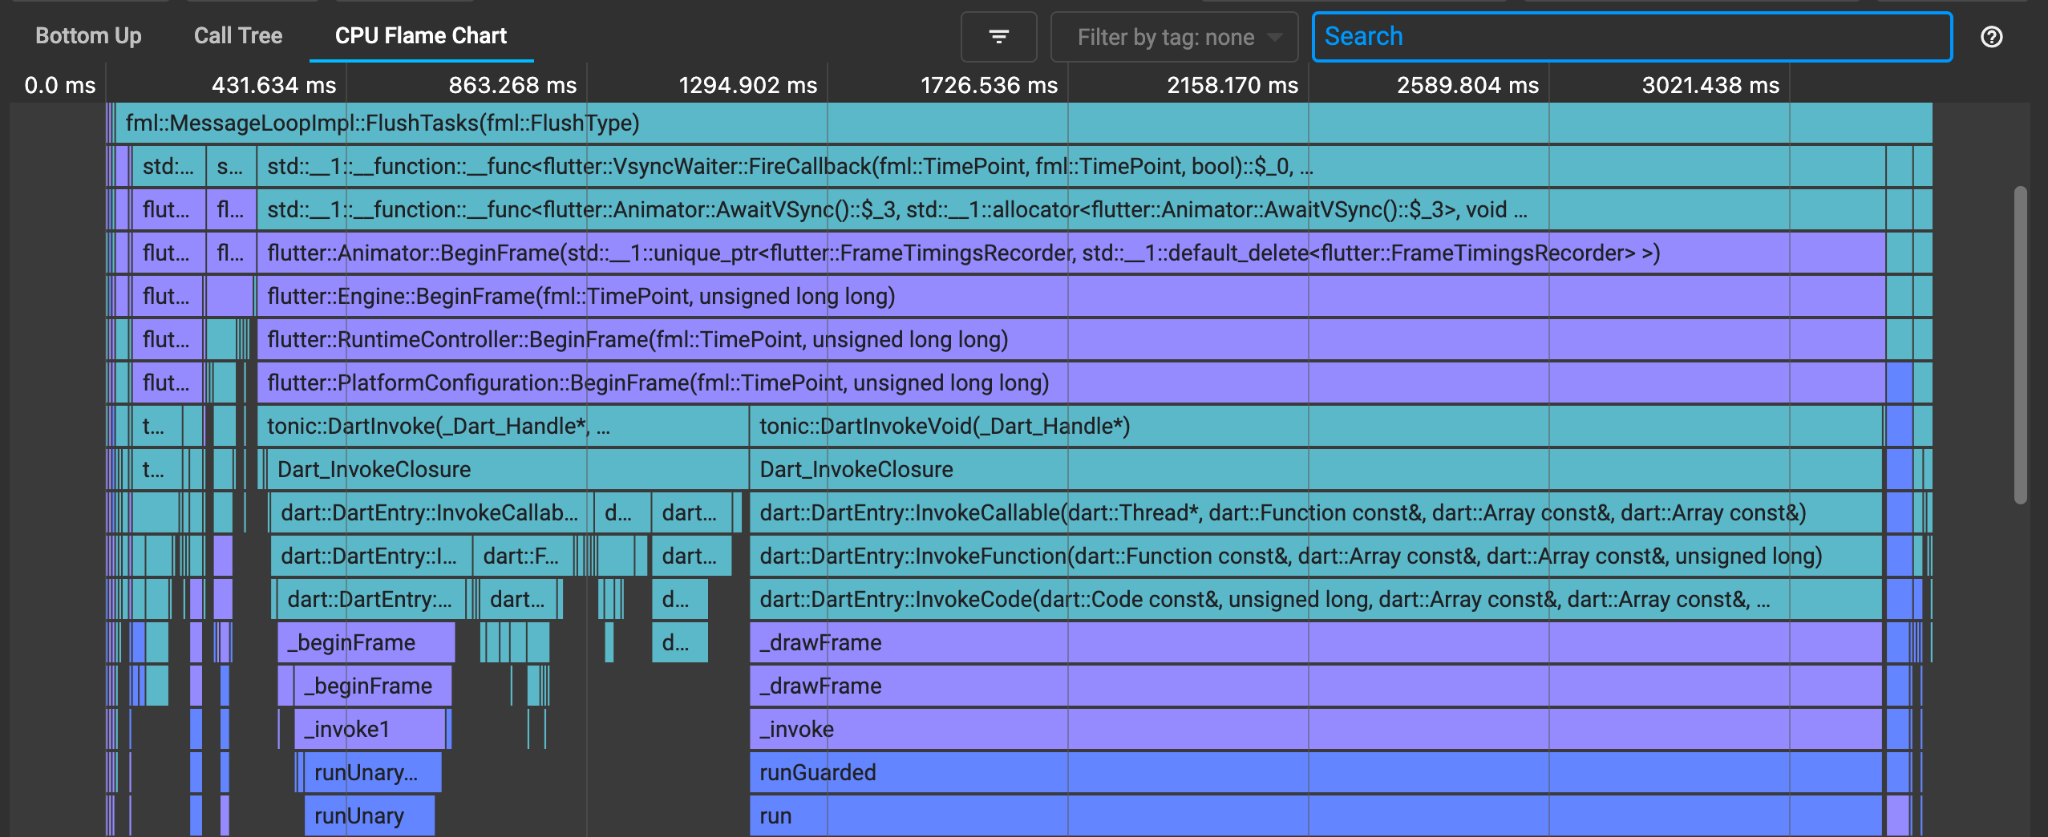
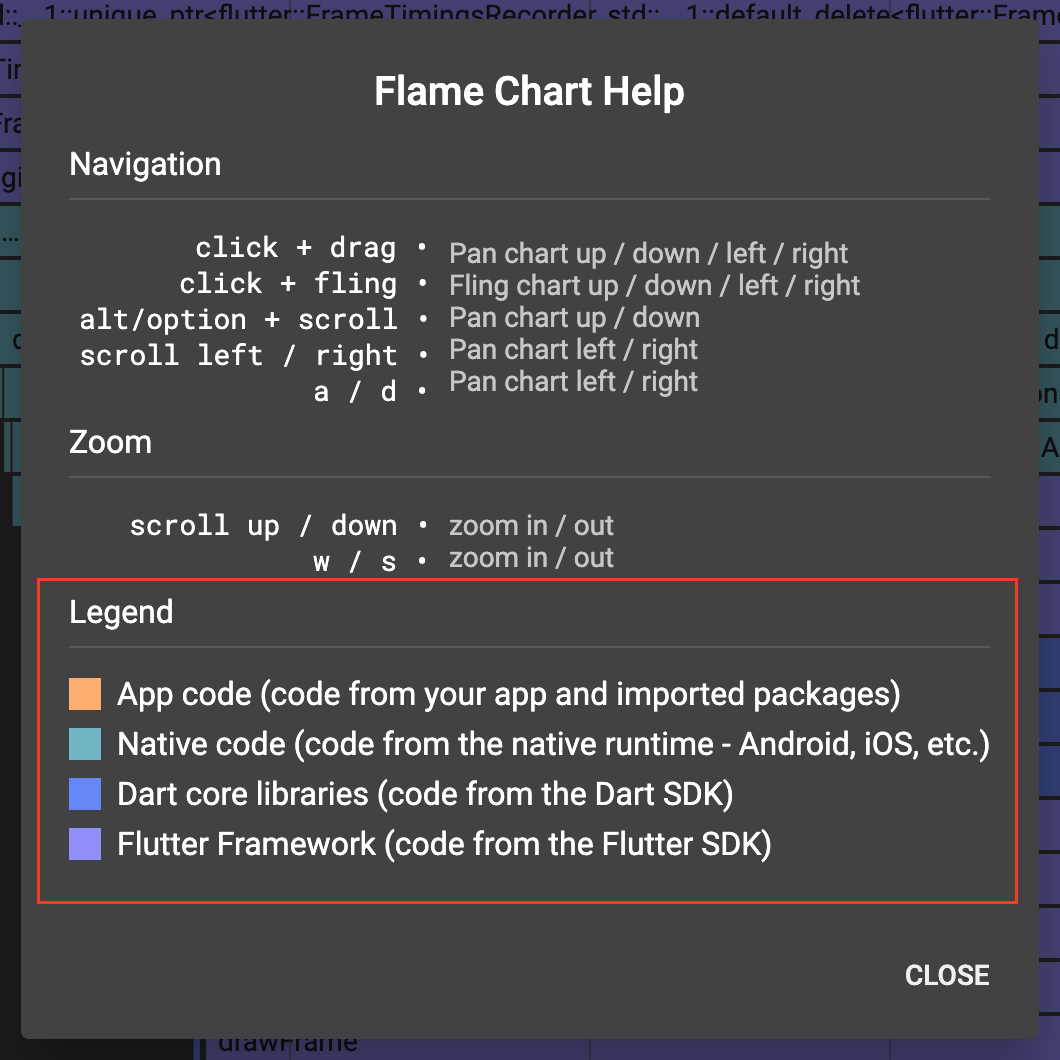
Color CPU profile flame charts by category (App code, Native code, Dart core libraries, and Flutter Framework) - #3310, #3324
Add a warning for ios profiling issue and link to workaround - #3311
Performance improvements for the profiler - #3274

Debugger Updates
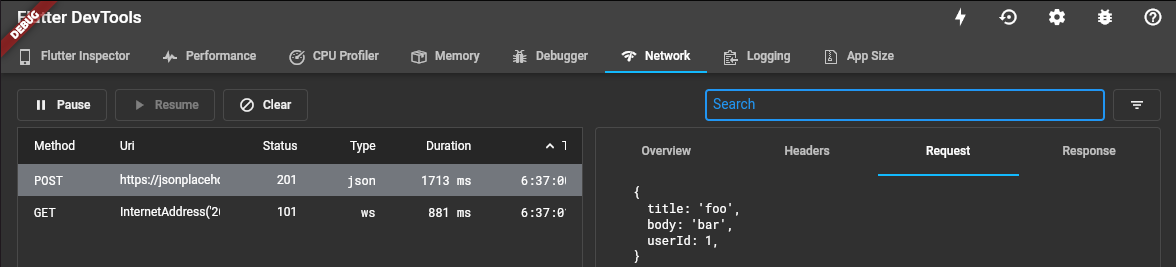
Network Profiler Updates
Show HTTP / HTTPS request body for POST requests - #3233
Show HTTP / HTTPS request body for POST requests - #3233
General Updates
Changelog
More details about changes and fixes are available in our changelog.
| Kenzie (Schmoll) Davisson | | Flutter DevExp | | kenzie...@google.com |