Flutter DevTools 2.4.0 Release Notes

Jacob Richman
Flutter DevTools 2.4.0 Release Notes
Flutter DevTools - A Suite of Performance Tools for Dart and Flutter
General Updates
Improve crash reporting #3100
Improve scrolling and zooming behavior for flame charts in the Performance and CPU Profiler pages #3107
Fix bug where you could trigger simultaneous app connections #3114
Update web app Favicon to be consistent with other Dart products #3119
Add support for forking features based on pre-release versions of Flutter #3134
Make warning and error banners more compact #3159
Perform more normalization of the input VM service URI to handle the service URL printed by Flutter Tools #3160
Inspector Updates
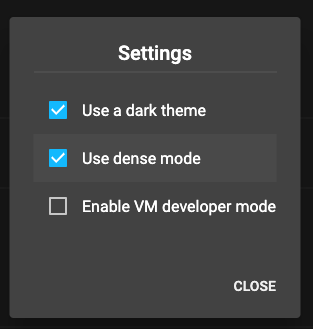
Add a dense mode for the Flutter Inspector. This will be enabled by default when using the embedded DevTools inspector in an IDE, and can optionally be enabled when using DevTools in the browser. #3149
Performance Updates
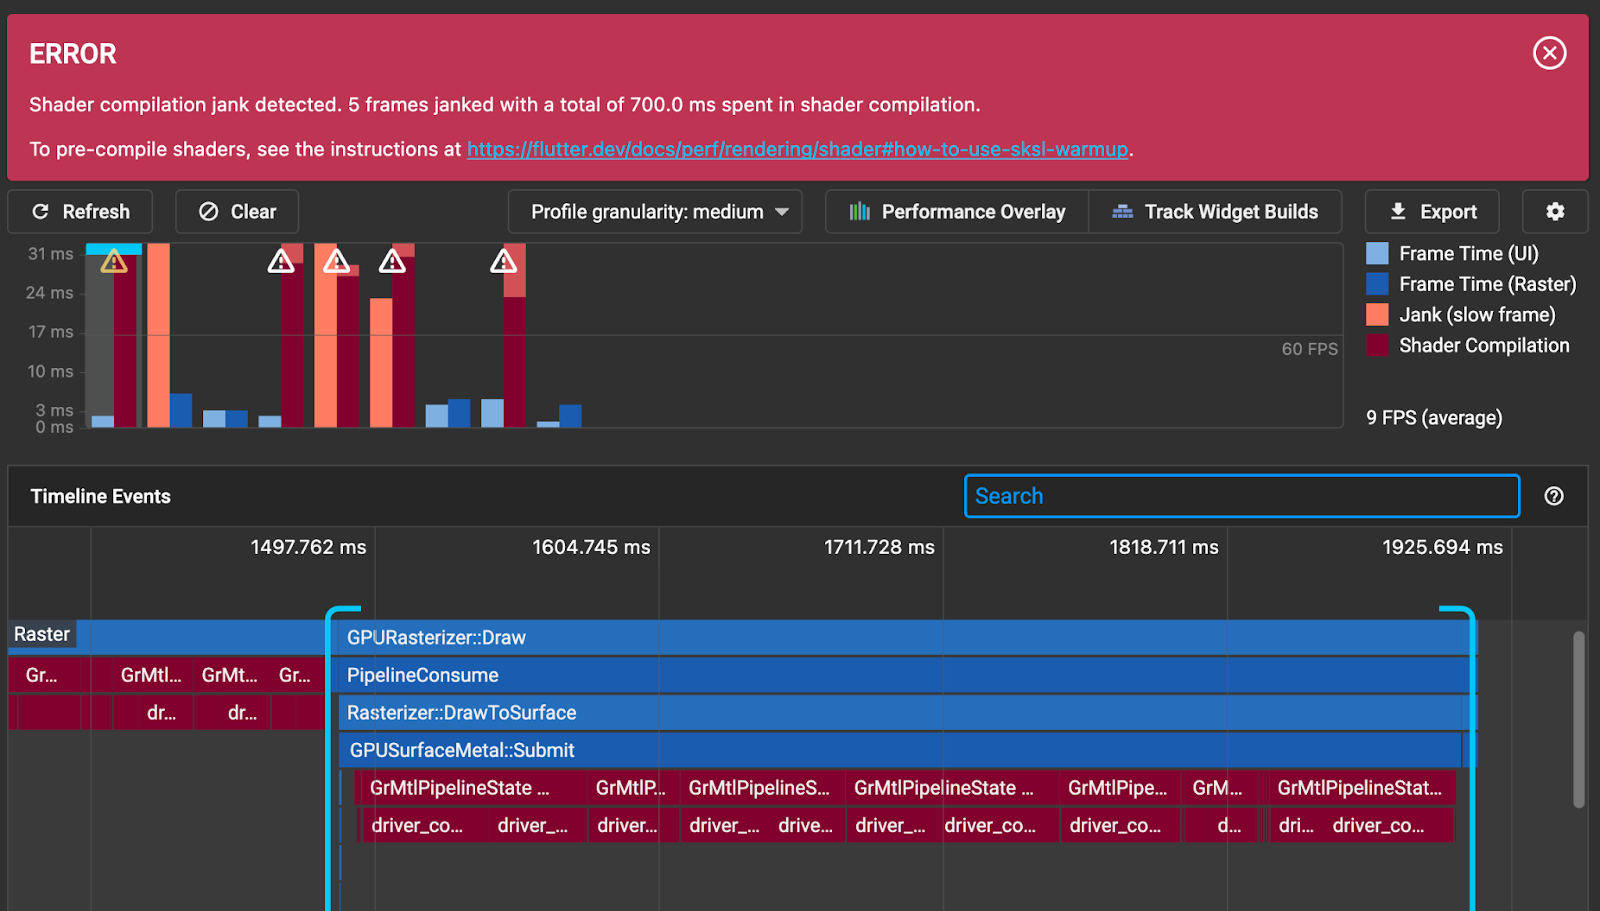
Added features for diagnosing shader compilation jank. When a Flutter frame janks due to compiling shaders, that will be called out in the Flutter frames chart. You can read about how to pre-cache shaders to eliminate this jank here. This documentation is also linked in the warning that will appear at the top of DevTools when shader compilation jank is detected. To use this feature, you’ll need to be on the latest version of Flutter (master channel). When running your Flutter app, make sure you run with the --purge-persistent-cache flag to ensure you can reproduce the shader compilation jank. This will clear the cache to ensure you are reproducing the problem users will see for the "first run" or "re-open" (iOS) experience.
Cache CPU profiles for selected timeline events so that data does not fall out of the CPU sample buffer once you have already loaded a profile #3121
Show an event summary view for events on the UI thread. Until this change, only the CPU profiler was displayed for UI thread events, but now both the CPU profiler and summary view are available for these events. We already show this information for events that are not on the UI thread.

CPU Profiler Updates
Disable CPU profiler controls while a recording is in progress to avoid bad state issues #3127
Fix NPEs #3142
Debugger Updates
App Size Tool Updates
Improve messaging when data is loading #3109
Changelog
More details about changes and fixes are available in our changelog.