Constantly increasing "pod_cache_watch_ignored" after scaling down a namespace
20 views
Skip to first unread message

Jan Kosecki
Jan 12, 2021, 6:40:41 AM1/12/21
to Fluentd Google Group
HI,
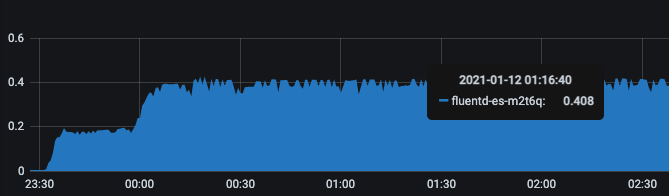
I'm trying to understand a sudden spike of CPU usage of a fluentd pod running on my k8s master.
I'm trying to understand a sudden spike of CPU usage of a fluentd pod running on my k8s master.
Around that time we are scaling down all pods and stateful sets that are in one of our dev namespaces, however the CPU usage shown is for a fluentd pod that lives on a master node, which doesn't have any pods deployed from this namespace.
I had a look at fluentd logs of this pod and I see a change in logs around the time
I had a look at fluentd logs of this pod and I see a change in logs around the time
2021-01-11 23:32:23 +0000 [info]: #0 [filter_kubernetes_metadata] stats - namespace_cache_size: 1, pod_cache_size: 16, pod_cache_watch_ignored: 2885, namespace_cache_api_updates: 112, pod_cache_api_updates: 112, id_cache_miss: 112, pod_cache_watch_delete_ignored: 860, pod_cache_watch_misses: 6223, pod_cache_watch_updates: 372
2021-01-11 23:32:53 +0000 [info]: #0 [filter_kubernetes_metadata] stats - namespace_cache_size: 1, pod_cache_size: 16, pod_cache_watch_ignored: 4115, namespace_cache_api_updates: 114, pod_cache_api_updates: 114, id_cache_miss: 114, pod_cache_watch_delete_ignored: 860, pod_cache_watch_misses: 6223, pod_cache_watch_updates: 372
2021-01-11 23:33:23 +0000 [info]: #0 [filter_kubernetes_metadata] stats - namespace_cache_size: 1, pod_cache_size: 8, pod_cache_watch_ignored: 5376, namespace_cache_api_updates: 114, pod_cache_api_updates: 114, id_cache_miss: 114, pod_cache_watch_delete_ignored: 860, pod_cache_watch_misses: 6223
2021-01-11 23:33:53 +0000 [info]: #0 [filter_kubernetes_metadata] stats - namespace_cache_size: 1, pod_cache_size: 8, pod_cache_watch_ignored: 6561, namespace_cache_api_updates: 114, pod_cache_api_updates: 114, id_cache_miss: 114, pod_cache_watch_delete_ignored: 860, pod_cache_watch_misses: 6223
Also, even today, after the namespace has been scaled up, the value of "pod_cache_watch_ignored" is still increasin:
2021-01-12 11:17:35 +0000 [info]: #0 [filter_kubernetes_metadata] stats - namespace_cache_size: 1, pod_cache_size: 9, pod_cache_watch_ignored: 1798797, namespace_cache_api_updates: 198, pod_cache_api_updates: 198, id_cache_miss: 198
Thanks
Thanks

Kentaro Hayashi
Jan 13, 2021, 9:40:39 PM1/13/21
to Fluentd Google Group
Hi,
Could you explain in detail to reproduce the steps for your issue
(what you did/what you didn't/used version, environment information or something else)?
It may be useful to get more feedback.
Regards,
2021年1月12日火曜日 20:40:41 UTC+9 j...@post-quantum.com:
Jan Kosecki
Jan 18, 2021, 6:39:23 AM1/18/21
to flu...@googlegroups.com
Hi,

I can’t really define what was the reason that triggered such a high CPU usage. We are using fluentd in all our clusters and in both we were experiencing very high CPU usage of fluentd and kibe-api, which after deleting all daemonset pods (kubectl -n kube-system patch daemonset fluentd-es -p '{"spec": {"template": {"spec": {"nodeSelector": {"non-existing": "true"}}}}}’) reduced to very low values and stays stable for now.
Below is the change of the CPU usage on one of our prod master nodes, with red being fluentd usage and purple kube-api’s.
Initially we though that te issue was related to our constant scaling pods up and down in DEV cluster, which we do every day after work hours. However, our production is a stable environment and we don’t do such scaling there and the fluentd usage was high anyway.
For now we have upgrading fluentd and all plugins and will be monitoring closely CPU usage. If we experience another spike in the usage, I’ll update this thread.
Environment:
Kubernetes: 1.18.4
Fluentd: v1.9-debian-1
fluent-plugin-kubernetes_metadata_filter: 2.4.2
We are using custom fluentd docker based on https://github.com/fluent/fluentd-kubernetes-daemonset but with some additional plugins.
Thanks,
Jan
On 14 Jan 2021, at 02:40, Kentaro Hayashi <ken...@gmail.com> wrote:
Hi,Could you explain in detail to reproduce the steps for your issue(what you did/what you didn't/used version, environment information or something else)?It may be useful to get more feedback.Regards,
2021年1月12日火曜日 20:40:41 UTC+9 j...@post-quantum.com:
HI,
I'm trying to understand a sudden spike of CPU usage of a fluentd pod running on my k8s master.
<Screenshot 2021-01-12 at 11.27.17.png>Around that time we are scaling down all pods and stateful sets that are in one of our dev namespaces, however the CPU usage shown is for a fluentd pod that lives on a master node, which doesn't have any pods deployed from this namespace.
I had a look at fluentd logs of this pod and I see a change in logs around the time2021-01-11 23:32:23 +0000 [info]: #0 [filter_kubernetes_metadata] stats - namespace_cache_size: 1, pod_cache_size: 16, pod_cache_watch_ignored: 2885, namespace_cache_api_updates: 112, pod_cache_api_updates: 112, id_cache_miss: 112, pod_cache_watch_delete_ignored: 860, pod_cache_watch_misses: 6223, pod_cache_watch_updates: 3722021-01-11 23:32:53 +0000 [info]: #0 [filter_kubernetes_metadata] stats - namespace_cache_size: 1, pod_cache_size: 16, pod_cache_watch_ignored: 4115, namespace_cache_api_updates: 114, pod_cache_api_updates: 114, id_cache_miss: 114, pod_cache_watch_delete_ignored: 860, pod_cache_watch_misses: 6223, pod_cache_watch_updates: 3722021-01-11 23:33:23 +0000 [info]: #0 [filter_kubernetes_metadata] stats - namespace_cache_size: 1, pod_cache_size: 8, pod_cache_watch_ignored: 5376, namespace_cache_api_updates: 114, pod_cache_api_updates: 114, id_cache_miss: 114, pod_cache_watch_delete_ignored: 860, pod_cache_watch_misses: 62232021-01-11 23:33:53 +0000 [info]: #0 [filter_kubernetes_metadata] stats - namespace_cache_size: 1, pod_cache_size: 8, pod_cache_watch_ignored: 6561, namespace_cache_api_updates: 114, pod_cache_api_updates: 114, id_cache_miss: 114, pod_cache_watch_delete_ignored: 860, pod_cache_watch_misses: 6223Also, even today, after the namespace has been scaled up, the value of "pod_cache_watch_ignored" is still increasin:2021-01-12 11:17:35 +0000 [info]: #0 [filter_kubernetes_metadata] stats - namespace_cache_size: 1, pod_cache_size: 9, pod_cache_watch_ignored: 1798797, namespace_cache_api_updates: 198, pod_cache_api_updates: 198, id_cache_miss: 198
Thanks
--
You received this message because you are subscribed to a topic in the Google Groups "Fluentd Google Group" group.
To unsubscribe from this topic, visit https://groups.google.com/d/topic/fluentd/JoyghI01Qqo/unsubscribe.
To unsubscribe from this group and all its topics, send an email to fluentd+u...@googlegroups.com.
To view this discussion on the web visit https://groups.google.com/d/msgid/fluentd/520ae50d-cf48-48cf-947c-199ed80f24f1n%40googlegroups.com.
<Screenshot 2021-01-12 at 11.27.17.png>
PQ Solutions Limited (trading as ‘Post-Quantum’) is a private limited company incorporated in England and Wales with registered number 06808505.
This email is meant only for the intended recipient. If you have received this email in error, any review, use, dissemination, distribution, or copying of this email is strictly prohibited. Please notify us immediately of the error by return email and please delete this message from your system. Thank you in advance for your cooperation.
For more information about Post-Quantum, please visit www.post-quantum.com.
In the course of our business relationship, we may collect, store and transfer information about you. Please see our privacy notice at www.post-quantum.com/privacy-notice to learn about how we use this information.
Reply all
Reply to author
Forward
0 new messages