multiple rays from origin to line plot
36 views
Skip to first unread message


Ced
Sep 11, 2015, 6:35:28 PM9/11/15
to Flot graphs
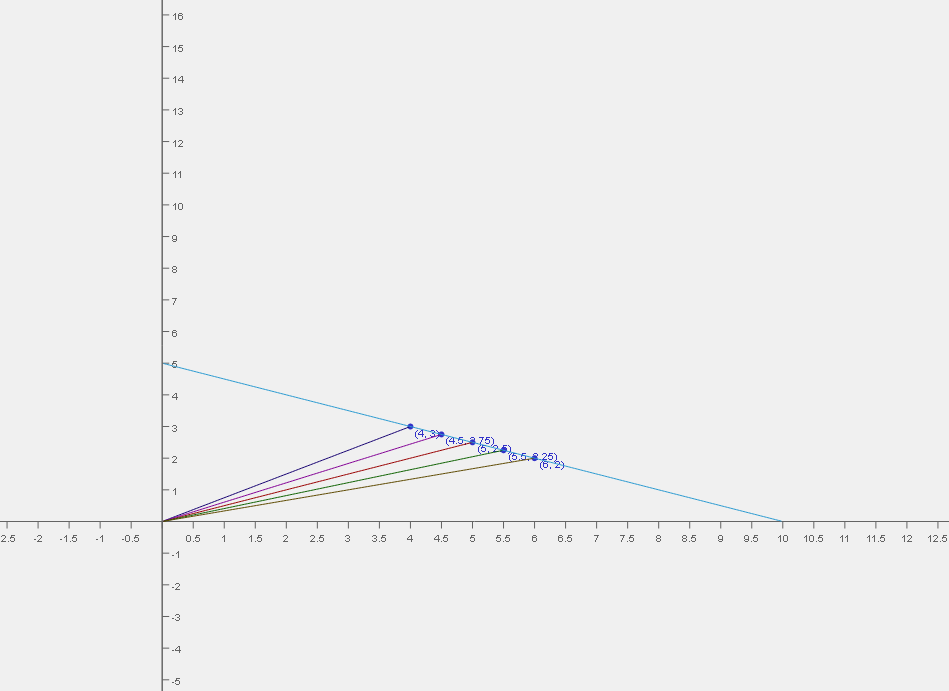
I think you'll have to process the series before plotting it to add some additional line series.
For a single line series, perhaps something like this:
Here's a working example for just the rays:
http://jsfiddle.net/vfLzp2bw/1/
Here's an example including the original line extrapolated to the axes. The rays() function works a bit differently in this one by creating an entirely new data array instead of modifying the original.
http://jsfiddle.net/vfLzp2bw/
For a single line series, perhaps something like this:
function rays(data) {

    // Create a reference to the original data series.
    var series = data[0];

    for (var i=0; i<series.data.length; i++) {
        // Create a new data series for each ray
        // Set a label=null so these series will not show in legend
        var ray = {
            data: [[0,0], [series.data[i][0], series.data[i][1]]],
            label: null,
            points: {
                show: false
            }
        }
        // Insert the new ray series at the start of the data array
        // This will make flot draw the rays under the original data series
        data.unshift(ray);
    }

    return data;
}
Here's a working example for just the rays:
http://jsfiddle.net/vfLzp2bw/1/
Here's an example including the original line extrapolated to the axes. The rays() function works a bit differently in this one by creating an entirely new data array instead of modifying the original.
http://jsfiddle.net/vfLzp2bw/
Reply all
Reply to author
Forward
0 new messages