number concentration with and without fire at 1m and 1,5m below the nozzle
74 views
Skip to first unread message

rajath ramachandran
May 9, 2022, 4:43:27 PM5/9/22
to FDS and Smokeview Discussions
Hei Folks ,
please refer the picture and code. I feel that monodisperse spray (orange line ) seems incorrect during both the criteria May I know why is this happening. 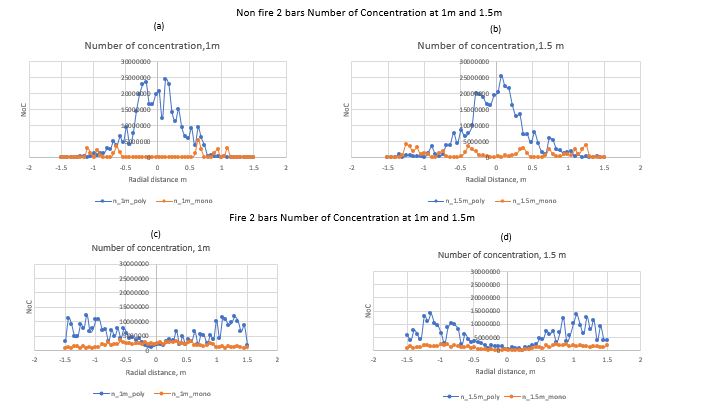

dr_jfloyd
May 9, 2022, 6:08:20 PM5/9/22
to FDS and Smokeview Discussions
You have already asked this question. In my response in your earlier post I noted you have an unresolved spray and that a monodisperse distribution is very different from a non-monodisperse distribution in terms of the number of droplets. These input files have not done anything to improve the spray resolution. Did you make any effort to try the suggestions I made?
rajath ramachandran
May 9, 2022, 6:10:49 PM5/9/22
to FDS and Smokeview Discussions
yes, I have improved the grid resolution, from 20 to 80 and it's still running. I will let you know the results once the simulation is completed
dr_jfloyd
May 10, 2022, 8:23:04 AM5/10/22
to FDS and Smokeview Discussions
In the case you attached you have 5000 drops/s for 300 s, a 20 cm grid, and PDPA devices with a 1.2 cm radius. Your spray occupies maximum width of ~3 m. You therefore have 1.5 million drops in an area that is 9 m2. This means that, on average, over the 300 s simulation each PDPA device within the spray cone will see a couple dozen drops or about 0.1 drops/s pass through its volume. This is not very many drops to be attempting to measure any drop statistics with.
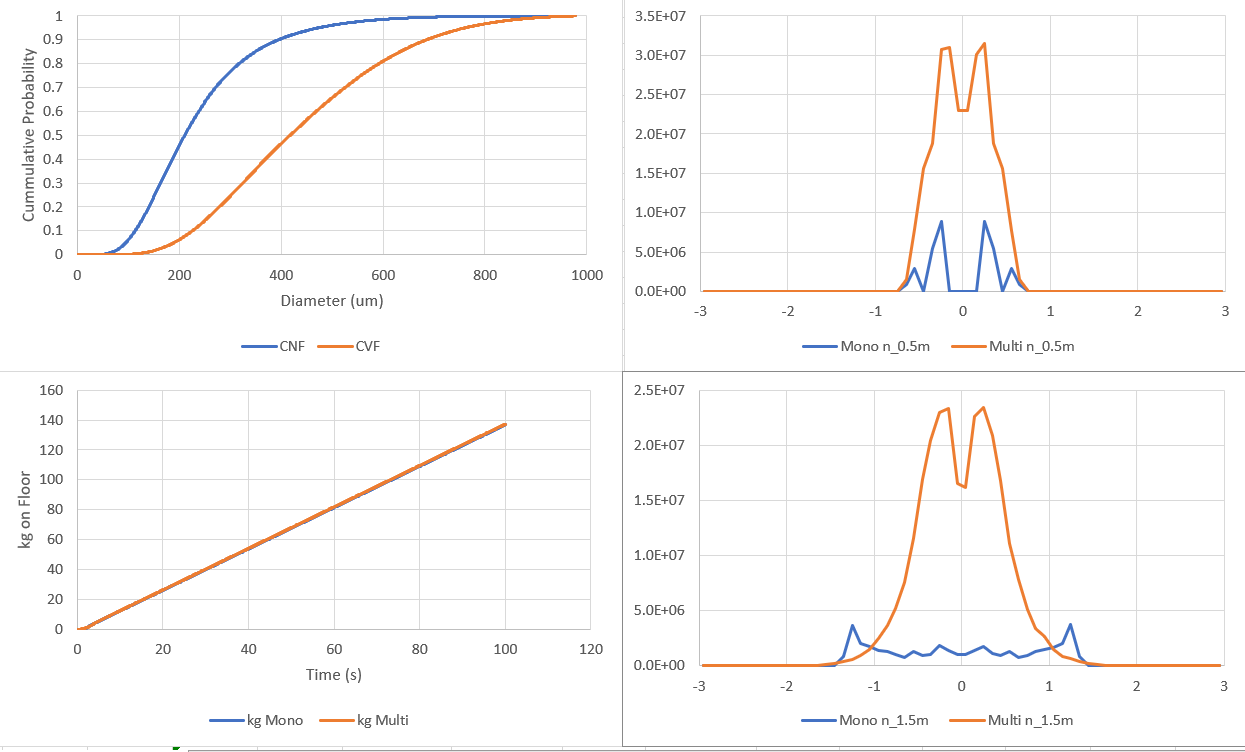
In the attached case for your spray with a size distribution I upped the grid resolution from 20 cm to 10 cm, make the domain wider to reduce any edge effects from having the open boundary close to the spray cone, up the particles to 40,000 per second, increase the PDPA radius to 5 cm, and decrease the time to 100 s. I also removed the REAC and turned off radiation to speed up the calculation (since we are just focusing on if the is working these aren't needed), set the humidity to 100 % to stop evaporation, and added an AMPUA device to the floor. I also ran a monodisperse version of the attached case. With this case, on average, ~3500 drops (~12 drops/s) pass through each PDPA device.
The top left image below is data from the cdf.csv file written by FDS. You can see that at 419 um the CVF (cumulative volume fraction) is 0.5 as expected since the FDS diameter input is for the median volume fraction. However the CNF (cumulative number fraction) at 419 um is 0.92. In terms of the number of drops, half of the drops are below 200 um. In other words, the monodisperse spray which is only 419 um drops requires many fewer drops for a given flow rate than the polydisperse spray which has both small and large drops. If you do the math, the polydisperse spray will have about 3 times the number of drops.
The bottom left image is the AMPUA device at the floor. There is a tiny offset between the curves since the smaller drops in the polydisperse spray take slightly longer to reach the floor; however, after that they increase at the same rate meaning both the monodisperse and the polydisperse sprays are putting in the same amount of water.
The right images are the PDPA results 0.5 and 1.5 m below the sprinkler. At 0.5 m the two sprays have similar shapes for the radial profile. The polydisperse spray has peaks around 3E7 and the mono around 1E7 or a factor of 3. In the 1.5 m plot, the ratio of the peaks is larger, but the peaks for the monodisperse spray are at a much larger radius meaning the PDPA at that radius is measuring over a much larger fraction of the spray area than for the polydisperse spray.
rajath ramachandran
May 12, 2022, 4:06:08 PM5/12/22
to FDS and Smokeview Discussions
thanks for a detalied explantion and modifying my code
Reply all
Reply to author
Forward
0 new messages