Excel Macros – Create Interactive Australia Map using X Y Scatter chart
498 views
Skip to first unread message

ashish
Sep 14, 2012, 1:15:39 PM9/14/12
to excelvb...@googlegroups.com
If you want to show the revenue/sales information or any other info related to different states of Australia on Excel using map ,etc. Snapshot below

Download working file : https://www.box.com/s/zxze6upqralubvs2vcy9
Download the working file
- Go to worksheet "Source Data"
- Choose the states in col A of worksheet "Source Data" and add the info you would like to display in the text box in Col B . For example I am showing the sales done in that state.
- Apply VLOOKUP formula to get the X and Y coordinates from the worksheet "Lookup" (Please ensure all state names are correct and as per the list in worksheet "Lookup" .So that formula should not return NA )
- Click on Update chart button
- Goto 'Map" sheet move the mouse over series(RED dots) to display the state name and info provided in Col B.
How it is created .
- Create a simple X Y scatter chart
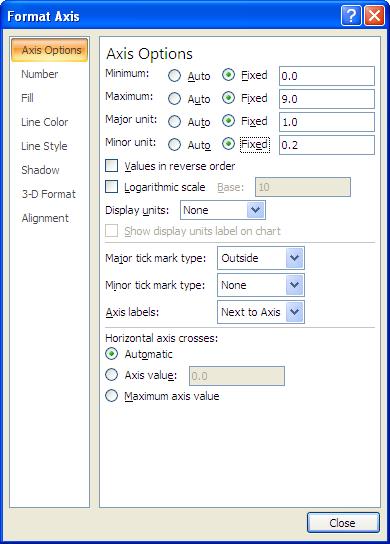
- Fix the X axis and Y axis option to fixed snapshot below
- Insert Australia map image as background of the chart
- Right click on chart choose Format Plot Area
- Choose Fill -> Picture or Texture
- Click on file and choose the location of Australia Map (Map Source https://upload.wikimedia.org/wikipedia/commons/thumb/c/c2/Australia_states_blank.svg/837px-Australia_states_blank.svg.png )
- Now Manually choose X and Y axis for each state
- Right click on X and Y axis choose Format Axis -> Line Color -> No line
- Right click on X and Y axis choose Font color as white
- Remove grid lines
Sub change_source_data()
Dim pw As String
Sheets("Map").Unprotect
Charts("Map").Select
' xxxxxxxxxxxxxxxxxxxxx delete existing series
Dim srs As Series
Dim ap As Points
For Each s In ActiveChart.SeriesCollection
s.Delete
Next s
' XXXXXXXXXXXXXXX adding series to charts
For i = 2 To Sheets("Source Data").Range("a65356").End(xlUp).Row
Set srs = ActiveChart.SeriesCollection.NewSeries
srs.Name = Sheets("Source Data").Range("a" & i).Value
srs.XValues = Sheets("Source Data").Range("c" & i).Value
srs.Values = Sheets("Source Data").Range("d" & i).Value
Next i
' xxxxxxxxxxxxxxxx change shape of labels
For Each s In ActiveChart.SeriesCollection
s.MarkerStyle = 6
s.MarkerSize = 15
s.MarkerBackgroundColor = RGB(255, 0, 0)
s.MarkerForegroundColor = RGB(255, 0, 0)
Next
Sheets("Map").Protect
End Sub
Below code is used to track the mouse movement on charts
Private Sub Chart_MouseMove(ByVal Button As Long, ByVal Shift As Long, ByVal x As Long, ByVal y As Long)
Dim ElementID As Long, Arg1 As Long, Arg2 As Long
Dim j As Long
ActiveChart.GetChartElement x, y, ElementID, Arg1, Arg2
If ElementID = xlSeries Then
ActiveSheet.Shapes("Textbox 1").Visible = True
j = Application.WorksheetFunction.Match(ActiveChart.SeriesCollection(Arg1).Name, Sheets("Source Data").Columns("a:a"), 0)
ActiveSheet.Shapes("Textbox 1").TextFrame.Characters.Text = "State: " & ActiveChart.SeriesCollection(Arg1).Name _
& vbNewLine _
& "Sales: " & VBA.Format(Sheets("Source Data").Range("b" & j).Value, "$#,##0")
Else
ActiveSheet.Shapes("Textbox 1").Visible = False
ActiveSheet.Shapes("Textbox 1").TextFrame.Characters.Text = ""
End If
End Sub
Reply all
Reply to author
Forward
0 new messages