Minor Annoyances

jtr...@gmail.com
So these issues have nothing to do with the actual operations
of Eureqa, but here they are:
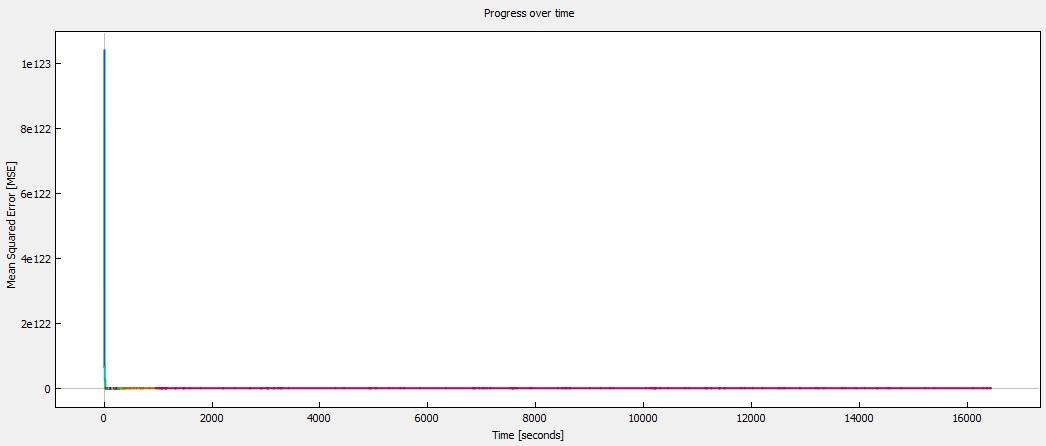
2) When the search starts, the objective function (squared error) is initially 1e123. Within a few seconds it quickly drops down to around 1,000. After a few minutes, it drops to a “stable” 212. However, in the “progress over time” charts, the y-axis is set to 1e123. I want a quick way to zoom it down to just 1,000 so that I can see the "meaningful" improvements. The only way I can figure out is by drawing “zoom boxes”, and it is not really feasible to zoom in so far using this method. See attached screenshot in case I am not explaining this well.
Is there a workaround for either of these issues that I don’t see? How do I make an official “feature request” to have these issues addressed in future versions?
Thanks.
Jon

benedict gbg

Andrew Lamb
--
You received this message because you are subscribed to the Google Groups "Eureqa Group" group.
To unsubscribe from this group and stop receiving emails from it, send an email to eureqa-group...@googlegroups.com.
For more options, visit https://groups.google.com/groups/opt_out.

Michael Schmidt
This great. You might also consider using the logarithm error metric if you encounter large variation in errors like this.
For the first one (rearranging searches in the project tree), an ugly workaround might be to duplicate a search to move it to the end, then delete the original.
I can give you a workaround for problem 2. Stop the search, change error metrics to something else, for example mean error, start the search and them immediately stop it, change error metrics back to squared error, start the search again. Your Y-axis will have a top of 212 now.
--