RnBeads Combine & Estimate Proportions

Peter Mcerlean
Samples
Object of class RnBeadRawSet
8 samples
782028 probes
of which: 782028 CpG, 0 CpH, and 0 rs
Region types:
237462 regions of type tiling
32035 regions of type genes
41684 regions of type promoters
24870 regions of type cpgislands
Intensity information is present
Detection p-values are present
Bead counts are present
Quality control information is present
Summary of normalization procedures:
The methylation data was normalized with method wm.dasen.
No background correction was performed.
BluePrint
Object of class RnBiseqSet
8 samples
24790847 methylation sites
Region types:
533764 regions of type tiling
50336 regions of type genes
53767 regions of type promoters
26065 regions of type cpgislands
Coverage information is present
Combined <- combine(BluePrint,Samples, type= "common")
Error in do.call(combine, list(y, ...)) :
argument "y" is missing, with no default
Combined <- combine(BluePrint,Samples)
Combined
Object of class RnBiseqSet
16 samples
24820689 methylation sites
Region types:
533990 regions of type tiling
50413 regions of type genes
53913 regions of type promoters
26182 regions of type cpgislands
Coverage information is absent

Michael Scherer
rnb.set <- load.rnb.set("path_to_RnBiseqSet")
ref.set <- load.rnb.set("path_to_RnBeadRawSet")
anno.rnb <- annotation(rnb.set)
anno.rnb <- GRanges(Rle(anno.rnb$Chromosome),IRanges(start=anno.rnb$Start,end=anno.rnb$End),strand=anno.rnb$Strand)
anno.ref <- annotation(rnb.set)
anno.ref <- GRanges(Rle(anno.ref$Chromosome),IRanges(start=anno.ref$Start,end=anno.ref$End),strand=anno.ref$Strand)
op <- findOverlaps(anno.rnb,anno.ref)
anno.new.rnb <- anno.ref[subjectHits(op)]
anno.new.rnb <- data.frame(chromosome=seqnames(anno.new.rnb),position=start(anno.new.rnb),strand=strand(anno.new.rnb))
new.meth <- meth(rnb.set)[queryHits(op),]
rnb.set <- RnBiseqSet(pheno(rnb.set),sites=anno.new.rnb,meth=new.meth,assembly="hg19")
rnb.options(identifiers.column="sample_id")
rnb.set <- combine(rnb.set,ref.set)
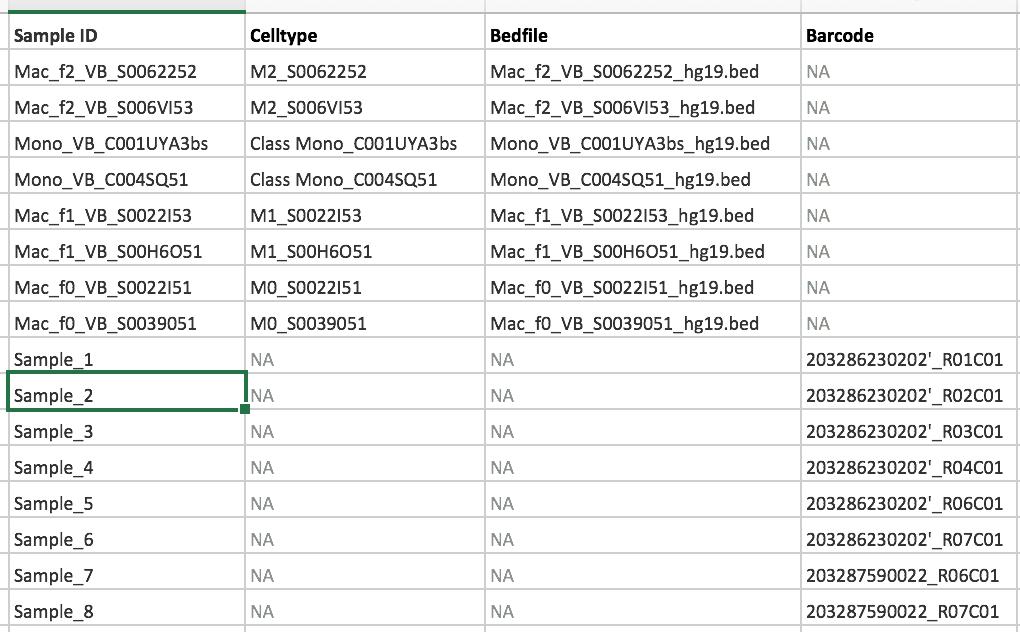
For the second issue you raised: RnBeads requires multiple replicates of a cell type to compute the proportions. In the first step, cell-type specific CpGs are determined similar to a differential analysis, this is why multiple samples per group (here cell type) are required. As far as I can see it in your sheet, you have some cell types with only a single sample. Do you have access to more samples?
Peter Mcerlean
> library(RnBeads)
> ref.set <- load.rnb.set("/Users/…/EPIC_rnbSet_preprocessed")
Warning messages:
1: In FUN(X[[i]], ...) : NOTE: did not overwrite file 'ff141261f3d829.ff'
2: In FUN(X[[i]], ...) : NOTE: did not overwrite file 'ff141262ff46cbf.ff'
> ref.set
Object of class RnBeadRawSet
12 samples
784977 probes
of which: 784977 CpG, 0 CpH, and 0 rs
Region types:
237785 regions of type tiling
32055 regions of type genes
41697 regions of type promoters
24889 regions of type cpgislands
Intensity information is present
Detection p-values are present
Bead counts are present
Quality control information is present
Summary of normalization procedures:
The methylation data was normalized with method wm.dasen.
No background correction was performed.
> rnb.set <- load.rnb.set("/Users/…/rnbSet_WGBS_preprocessed.zip")
> rnb.set
Object of class RnBiseqSet
12 samples
24775763 methylation sites
Region types:
533515 regions of type tiling
53668 regions of type promoters
50281 regions of type genes
26017 regions of type cpgislands
Coverage information is present
> anno.rnb <- annotation(rnb.set)
> anno.rnb <- GRanges(Rle(anno.rnb$Chromosome),IRanges(start=anno.rnb$Start,end=anno.rnb$End),strand=anno.rnb$Strand)
> anno.ref <- annotation(ref.set) <- I think this was a typo in the original post
> anno.ref <- GRanges(Rle(anno.ref$Chromosome),IRanges(start=anno.ref$Start,end=anno.ref$End),strand=anno.ref$Strand)
> op <- findOverlaps(anno.rnb,anno.ref)
> anno.new.rnb <- anno.ref[subjectHits(op)]
> anno.new.rnb <- data.frame(chromosome=seqnames(anno.new.rnb),position=start(anno.new.rnb),strand=strand(anno.new.rnb))
> new.meth <- meth(rnb.set)[queryHits(op),]
> rnb.set <- RnBiseqSet(pheno(rnb.set),sites=anno.new.rnb,meth=new.meth,assembly="hg19")
> rnb.options(identifiers.column="Patient_ID")
> rnb.set.combined <- combine(rnb.set,ref.set)
> rnb.set.combined
Object of class RnBiseqSet
24 samples
784977 methylation sites
Region types:
237785 regions of type tiling
41697 regions of type promoters
32055 regions of type genes
24889 regions of type cpgislands
Coverage information is absent
> save.rnb.set(rnb.set.combined, path=file.path("/Users/…/RnBeads/, “Combine.test.170420”))
Michael Scherer
- I have made some bad experience with liftOver, since many sites are simply not mapped at all. You might loose some a substantial amount of information.
- Combining WGBS and EPIC data still has many caveats: For instance, bisulfite sequencing data will always be "more" bimodal than EPIC data, simply due to technical issue. It's hard to overcome this.
- If the proportions obtained using the cell type estimation make sense to you, I think it's fine to use them even though there might be a technical bias.
Peter Mcerlean
Michael Scherer
Peter Mcerlean
Cell.comp <-rnb.execute.ct.estimation(rnb.set.combined, cell.type.column = “CellType”, test.max.markers = 50000, top.markers = 500, method = "houseman1", verbose = TRUE)
>Cell.comp
….
$most.variable
[1] 156150…87176…41285 …
$coef.ests
M2 Class_Mono M1 M0 Mono
30451247 0.020204082 0.865195332 0.006535948 0.000000000 0.985714286
17829019 0.043181818 0.906926554 0.049203468 0.015873016 0.960284281
1653259 0.012500000 0.932564103 0.000000000 0.000000000 0.803571429
$markers
[1] 59752…3272…8379…
>annot.sites <- annotation(either - rnb.set/ref.set/rnb.set.combined)
>annot.sites.rnb.set
Chromosome Start End Strand Strand.1 AddressA AddressB Design Color Context Random
cg26928153 chr1 10848 10849 - - 91693541 47784201 I Grn CG FALSE
cg16269199 chr1 10850 10851 - - 82663207 3701821 I Grn CG FALSE
cg13869341 chr1 15865 15866 + + 2665852 39757192 I Red CG FALSE
>annot.sites.ref.set
Chromosome Start End Strand CpG GC CGI Relation SNPs HumanMethylation27 HumanMethylation450
13 chr1 10525 10526 + 8 67 Open Sea <NA> NA NA
129 chr1 10848 10849 + 15 74 Open Sea <NA> NA NA
131 chr1 10850 10851 + 15 74 Open Sea <NA> NA NA
>annot.sites.rnb.set.combined
Chromosome Start End Strand CpG GC CGI Relation SNPs HumanMethylation27 HumanMethylation450
12641 chr1 710097 710098 + 2 28 Shelf <NA> NA 34
13677 chr1 752696 752697 + 2 38 Open Sea <NA> NA NA
14583 chr1 778272 778273 + 5 60 Open Sea <NA> NA NA
Michael Scherer
Since the CellTypeInferenceResult is merely a list of objects, which you described above, there is no dedicated way to export the information other than standard R in- or output.

Ayesha Tariq
--
You received this message because you are subscribed to the Google Groups "Epigenomics forum" group.
To unsubscribe from this group and stop receiving emails from it, send an email to epigenomicsfor...@googlegroups.com.
To view this discussion on the web, visit https://groups.google.com/d/msgid/epigenomicsforum/86d0bf3e-c2e3-4b3c-8830-b4028db34054o%40googlegroups.com.
Michael Scherer
Ayesha Tariq
--
You received this message because you are subscribed to the Google Groups "Epigenomics forum" group.
To unsubscribe from this group and stop receiving emails from it, send an email to epigenomicsfor...@googlegroups.com.
To view this discussion on the web, visit https://groups.google.com/d/msgid/epigenomicsforum/abb2595e-9c98-420a-be72-2138fd2b79a8o%40googlegroups.com.
Peter Mcerlean
Ayesha Tariq
On 18-Jun-2020, at 11:17 AM, 'Michael Scherer' via Epigenomics forum <epigenom...@googlegroups.com> wrote:
--
You received this message because you are subscribed to the Google Groups "Epigenomics forum" group.
To unsubscribe from this group and stop receiving emails from it, send an email to epigenomicsfor...@googlegroups.com.
To view this discussion on the web, visit https://groups.google.com/d/msgid/epigenomicsforum/abb2595e-9c98-420a-be72-2138fd2b79a8o%40googlegroups.com.
Ayesha Tariq
| id | Chromosome | Start | End | symbol | entrezID | mean.mean.T1 | mean.mean.T2 | mean.mean.diff | mean.mean.quot.log2 | comb.p.val | comb.p.adj.fdr | combinedRank | num.sites | mean.num.na.T1 | mean.num.na.T2 | mean.mean.covg.T1 | mean.mean.covg.T2 | mean.nsamples.covg.thres5.T1 | mean.nsamples.covg.thres5.T2 |
| ENSG00000227232 | chr1 | 14363 | 29806 | WASH7P | 653635 | 0.37379381 | 0.347063 | 0.02673081 | -0.0065004 | 0.00013973 | 0.00034358 | 27172 | 5 | 0 | 0 | 12.15 | 12.3935484 | 15.8 | 30.8 |
--
You received this message because you are subscribed to the Google Groups "Epigenomics forum" group.
To unsubscribe from this group and stop receiving emails from it, send an email to epigenomicsfor...@googlegroups.com.
To view this discussion on the web, visit https://groups.google.com/d/msgid/epigenomicsforum/28e4b2fd-c764-4642-90ff-8c4e2b144838o%40googlegroups.com.
s9ml...@googlemail.com
Ayesha Tariq
On 30-Jun-2020, at 11:18 AM, 's9ml...@googlemail.com' via Epigenomics forum <epigenom...@googlegroups.com> wrote:
Hi Ayesha,This depends on the setting that you have and what you compare . In the example below, the DMR is hypermethylated in the first group (T1), i.e. hypomethylated in the second (T2).Best,Michaelatar...@ole.augie.edu schrieb am Montag, 29. Juni 2020 um 11:17:30 UTC+2:Hi Michael,Negative mean.mean.diff is hyper methylated?On 18-Jun-2020, at 11:17 AM, 'Michael Scherer' via Epigenomics forum <epigenom...@googlegroups.com> wrote:Hi Ayesha,You will have to look at the mean.mean.diff value. In case it is negative, the first group has higher methylated (i.e. hypermethylated) and in case it is negative, the first group is lower methylated (i.e. hypomethylated).Best,Michael--
You received this message because you are subscribed to the Google Groups "Epigenomics forum" group.
To unsubscribe from this group and stop receiving emails from it, send an email to epigenomicsfor...@googlegroups.com.To view this discussion on the web, visit https://groups.google.com/d/msgid/epigenomicsforum/abb2595e-9c98-420a-be72-2138fd2b79a8o%40googlegroups.com.
--
You received this message because you are subscribed to the Google Groups "Epigenomics forum" group.
To unsubscribe from this group and stop receiving emails from it, send an email to epigenomicsfor...@googlegroups.com.
To view this discussion on the web, visit https://groups.google.com/d/msgid/epigenomicsforum/dc3680b4-ac3b-435c-98f6-cff8da81c931n%40googlegroups.com.