monitoring - health data
12 views
Skip to first unread message

vajonam
Mar 8, 2021, 9:45:56 AM3/8/21
to EON ZFS Storage
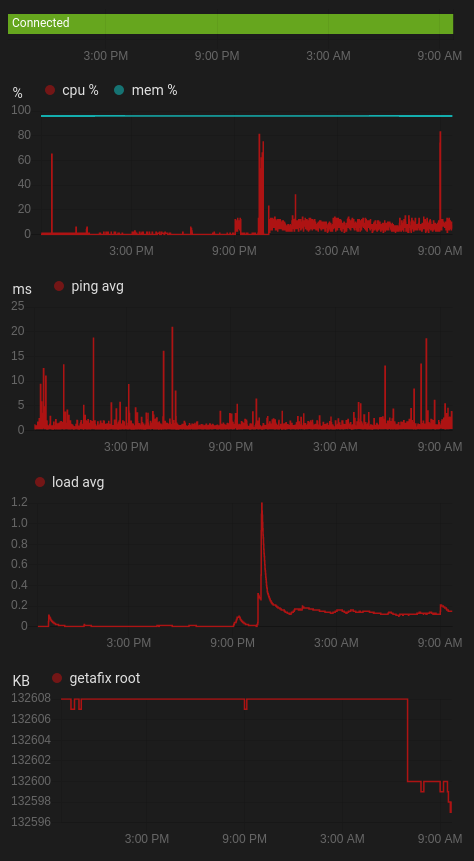
one thing I find lacking is the monitorability of eon. not that it needs much monitoring to be honest, but with a previous version I used to have some issues specifically around running out of disk space on root /, and other busy wait situation. this allows me to see it graphically and correlate it with that was going on around the network.
#!/bin/bash
DATA=`/usr/local/bin/top | cat | /usr/bin/egrep -e 'load average|idle|Memory' | sed 's/%//g'`
MEM_DATA=`/usr/local/bin/top | cat | /usr/bin/egrep -e 'Memory'`
DF=`/usr/bin/df -k / | grep -v File`
LOAD=`echo $DATA | awk '{print $5}'| tr ';' '\n'`
CPU_USAGE=`mpstat -a 1 3 | tail -1 | awk {'printf $16'}`
CPU_USAGE=`echo 100-$CPU_USAGE | bc`
MEM_KB=`/usr/bin/vmstat |tail -1| awk '{printf $5}'`
MEM_FREE=`echo "scale=2;$MEM_KB/1024" | bc`
MEM_TOTAL=`echo $MEM_DATA | awk '{print $2}'| tr ',' '\n' | tr 'M' '\n'`
MEM_PERCENT=`echo "scale=2;(${MEM_TOTAL} - ${MEM_FREE}) / ${MEM_TOTAL} * 100" | bc`
ROOT_FREE=`echo $DF | awk '{print $4}'`
echo "{"\"load\"":"${LOAD}","\"cpu\"":"${CPU_USAGE}
output looks like
{"load":0.15,"cpu":11,"mem_free":151.15,"mem":96.00,"root_free":132597}
I use Node Red to call these shell scripts, I use ssh / authorized keys command feature. (https://www.linuxjournal.com/article/8257) to only allow those keys to run certain commands. Once NR gets the response back with is parsed and then dumped into home -assitant/influx db so I can watch this over time.
vajonam
Mar 8, 2021, 9:53:25 AM3/8/21
to EON ZFS Storage
sorry that last line was incomplete.
#!/bin/bash
DATA=`/usr/local/bin/top | cat | /usr/bin/egrep -e 'load average|idle|Memory' | sed 's/%//g'`
MEM_DATA=`/usr/local/bin/top | cat | /usr/bin/egrep -e 'Memory'`
DF=`/usr/bin/df -k / | grep -v File`
LOAD=`echo $DATA | awk '{print $5}'| tr ';' '\n'`
CPU_USAGE=`mpstat -a 1 3 | tail -1 | awk {'printf $16'}`
CPU_USAGE=`echo 100-$CPU_USAGE | bc`
MEM_KB=`/usr/bin/vmstat |tail -1| awk '{printf $5}'`
MEM_FREE=`echo "scale=2;$MEM_KB/1024" | bc`
MEM_TOTAL=`echo $MEM_DATA | awk '{print $2}'| tr ',' '\n' | tr 'M' '\n'`
MEM_PERCENT=`echo "scale=2;(${MEM_TOTAL} - ${MEM_FREE}) / ${MEM_TOTAL} * 100" | bc`
ROOT_FREE=`echo $DF | awk '{print $4}'`
echo "{"\"load\"":"${LOAD}","\"cpu\"":"${CPU_USAGE}","\"mem_free\"":"${MEM_FREE}",\""mem"\":"${MEM_PERCENT}",\""root_free"\":"${ROOT_FREE}"}"
Reply all
Reply to author
Forward
0 new messages