[Econ Grapher] Top 5 Economics Graphs of the Week - 22 May 2011
8 views
Skip to first unread message

Econ Grapher
May 21, 2011, 6:42:46 PM5/21/11
to econg...@googlegroups.com
This week we take a look at some inflation numbers from the EU and UK, and while on the topic have a check in on commodity prices. Then we review the latest GDP numbers from Japan, before finishing up with a check in on global monetary policy.
1. EU Inflation
The EU saw a continued spike in inflation, with Euro Area annual inflation at 2.8%, vs 2.7% in March (1.5% in April 2010), while EU annual inflation rose to 3.2% vs 3.1% in March (2.0% in April 2010). Meanwhile Euro Area Core inflation was perhaps the most remarkable, rising to 1.6% in April, from 1.3% in March, and just 0.8% in April 2010. The highest rate of inflation was seen in Romania (8.4%), followed by Estonia (5.4%); while the lowest rate of inflation was recorded in Switzerland at just 0.1%, followed by Norway with 1.3%. While there is a degree of divergence in results, inflation is broadly creeping upwards in the Euro Zone and Core inflation is fast approaching the ECB inflation target.

2. UK Inflation
Over in the UK, a similar theme of rising inflation was seen with April annual consumer price inflation of 4.5%, up from 4.0% in March, and 4.0% in April 2010. The spike in inflation in the UK has caused some to speculate on a sharp rise in interest rates from the Bank of England, with inflation still well above its official inflation target. However the Bank of England, by and large, is not particularly set on aggressive tightening, particularly when the UK economy is still struggling along in recovery mode. The most likely policy path will be a steady path of rate increases, perhaps commencing later this year, depending on how the broader economy fares.

3. Commodities
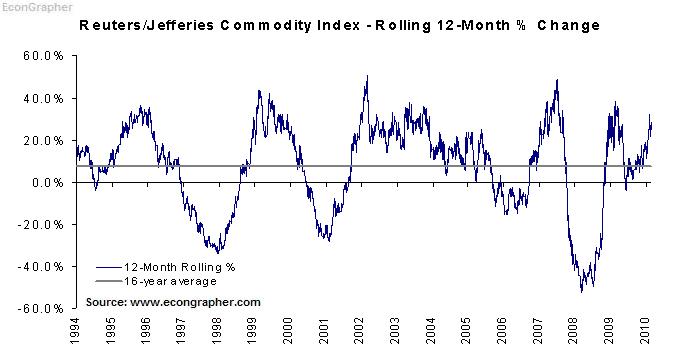
On a rolling 12 month return basis, the latest data shows commodities were up 35.6% as measured by the Reuters/Jefferies commodity index. On a rolling monthly basis though the figure was -6.6% driven by a sell-off in a few commodities, particularly Silver. Commodity prices continue to be the key variable for 2011, as rising prices have catalyzed uprisings and social unrest, driven surging inflation in emerging markets, and have begun to have an increasing impact on inflation in developed markets. There's also the growth risks that high commodity prices present. But commodities are probably a good example of mean reversion in practice as high prices generally lead to a supply response, thus prices shouldn't be able to run up too high for too long unless structural changes have taken place in the global economy.

4. Japan GDP
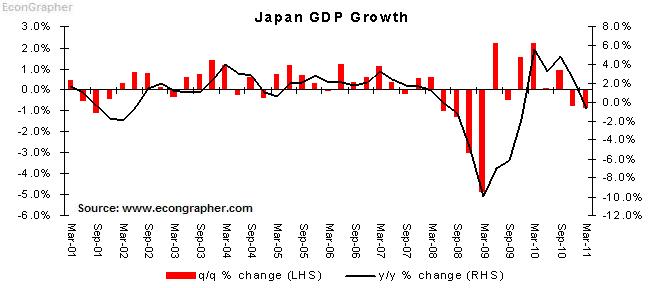
Japan had a disappointing Q1 GDP figure, with GDP declining -0.9% on a quarterly basis (annualised -3.7%) , compared to -0.8% in Q4 2010, while Q1 2010 was 2.2%. On an annual basis this mean contraction of -0.7%, compared to 2.4% in Q4 2010, and 5.5% in Q1 2010. Much of the negative results can be explained by the impact of the earthquake as the disaster weighed heavily on private consumption and caused supply chain disruption impacting on net exports, and general uncertainty limiting capital spending. As with most large scale disasters the economic pattern is a short-term hit, but a medium term spike. So, provided the Japanese government can manage the process well, the rebuilding phase should help Japan's economy return to growth later this year, with 2012 likely to see much stronger economic activity levels.

5. Monetary Policy
The past week in monetary policy was relatively quiet with only 5 central banks announcing monetary policy decisions, and of those, only 1 adjusting its policy stance. Vietnam was the only bank to adjust monetary policy settings; increasing its reverse repurchase rate by 100 basis points to 15.00%. Meanwhile those that held their monetary policy interest rates unchanged were: Serbia (12.50%), Hungary (6.00%), Sri Lanka (7.00%), and Japan (0.10%). So there was somewhat of a theme of emerging markets beginning to ease off on aggressive policy tightening (with the exception of Vietnam, which is still seeing rampant inflation) as some inflation pressures begin to ease, if not peak, and as the growth outlook comes to fore in terms of policy risk. Monetary policy, and by extension inflation, remains one of the key factors for the growth and financial market outlook in emerging markets this year.

Summary
So we saw the pace of inflation beginning to show a more marked uptrend in the Euro Zone, which may well mean that the ECB's interest rate increase in April will likely be repeated in the near term. Meanwhile the UK also saw a continued high rate of inflation, but the Bank of England is still unlikely to budge as the UK economy is still on the go-slow. On a related topic, commodity prices saw surging 12-month returns in May, but with monthly returns diving into negative territory, perhaps heralding an easing in commodity prices over the medium term. In Japan, first quarter GDP results were disappointing, driven into negative territory by the disaster impact. On monetary policy, further signs of a peak in monetary policy tightening for emerging markets surfaced as the growth-inflation risk mix is becoming increasingly finely balanced.
Sources
1. EuroStat epp.eurostat.ec.europa.eu
2. National Statistics Office www.statistics.gov.uk
3. Jefferies www.jefferies.com
4. OECD Statistics stats.oecd.org
5. Central Bank News www.centralbanknews.info
Article Source: http://www.econgrapher.com/top5graphs22may11.html
--
Posted By Econ Grapher to Econ Grapher at 5/21/2011 02:44:00 PM
1. EU Inflation
The EU saw a continued spike in inflation, with Euro Area annual inflation at 2.8%, vs 2.7% in March (1.5% in April 2010), while EU annual inflation rose to 3.2% vs 3.1% in March (2.0% in April 2010). Meanwhile Euro Area Core inflation was perhaps the most remarkable, rising to 1.6% in April, from 1.3% in March, and just 0.8% in April 2010. The highest rate of inflation was seen in Romania (8.4%), followed by Estonia (5.4%); while the lowest rate of inflation was recorded in Switzerland at just 0.1%, followed by Norway with 1.3%. While there is a degree of divergence in results, inflation is broadly creeping upwards in the Euro Zone and Core inflation is fast approaching the ECB inflation target.

2. UK Inflation
Over in the UK, a similar theme of rising inflation was seen with April annual consumer price inflation of 4.5%, up from 4.0% in March, and 4.0% in April 2010. The spike in inflation in the UK has caused some to speculate on a sharp rise in interest rates from the Bank of England, with inflation still well above its official inflation target. However the Bank of England, by and large, is not particularly set on aggressive tightening, particularly when the UK economy is still struggling along in recovery mode. The most likely policy path will be a steady path of rate increases, perhaps commencing later this year, depending on how the broader economy fares.

3. Commodities
On a rolling 12 month return basis, the latest data shows commodities were up 35.6% as measured by the Reuters/Jefferies commodity index. On a rolling monthly basis though the figure was -6.6% driven by a sell-off in a few commodities, particularly Silver. Commodity prices continue to be the key variable for 2011, as rising prices have catalyzed uprisings and social unrest, driven surging inflation in emerging markets, and have begun to have an increasing impact on inflation in developed markets. There's also the growth risks that high commodity prices present. But commodities are probably a good example of mean reversion in practice as high prices generally lead to a supply response, thus prices shouldn't be able to run up too high for too long unless structural changes have taken place in the global economy.
4. Japan GDP
Japan had a disappointing Q1 GDP figure, with GDP declining -0.9% on a quarterly basis (annualised -3.7%) , compared to -0.8% in Q4 2010, while Q1 2010 was 2.2%. On an annual basis this mean contraction of -0.7%, compared to 2.4% in Q4 2010, and 5.5% in Q1 2010. Much of the negative results can be explained by the impact of the earthquake as the disaster weighed heavily on private consumption and caused supply chain disruption impacting on net exports, and general uncertainty limiting capital spending. As with most large scale disasters the economic pattern is a short-term hit, but a medium term spike. So, provided the Japanese government can manage the process well, the rebuilding phase should help Japan's economy return to growth later this year, with 2012 likely to see much stronger economic activity levels.
5. Monetary Policy
The past week in monetary policy was relatively quiet with only 5 central banks announcing monetary policy decisions, and of those, only 1 adjusting its policy stance. Vietnam was the only bank to adjust monetary policy settings; increasing its reverse repurchase rate by 100 basis points to 15.00%. Meanwhile those that held their monetary policy interest rates unchanged were: Serbia (12.50%), Hungary (6.00%), Sri Lanka (7.00%), and Japan (0.10%). So there was somewhat of a theme of emerging markets beginning to ease off on aggressive policy tightening (with the exception of Vietnam, which is still seeing rampant inflation) as some inflation pressures begin to ease, if not peak, and as the growth outlook comes to fore in terms of policy risk. Monetary policy, and by extension inflation, remains one of the key factors for the growth and financial market outlook in emerging markets this year.

Summary
So we saw the pace of inflation beginning to show a more marked uptrend in the Euro Zone, which may well mean that the ECB's interest rate increase in April will likely be repeated in the near term. Meanwhile the UK also saw a continued high rate of inflation, but the Bank of England is still unlikely to budge as the UK economy is still on the go-slow. On a related topic, commodity prices saw surging 12-month returns in May, but with monthly returns diving into negative territory, perhaps heralding an easing in commodity prices over the medium term. In Japan, first quarter GDP results were disappointing, driven into negative territory by the disaster impact. On monetary policy, further signs of a peak in monetary policy tightening for emerging markets surfaced as the growth-inflation risk mix is becoming increasingly finely balanced.
Sources
1. EuroStat epp.eurostat.ec.europa.eu
2. National Statistics Office www.statistics.gov.uk
3. Jefferies www.jefferies.com
4. OECD Statistics stats.oecd.org
5. Central Bank News www.centralbanknews.info
Article Source: http://www.econgrapher.com/top5graphs22may11.html
--
Posted By Econ Grapher to Econ Grapher at 5/21/2011 02:44:00 PM
Reply all
Reply to author
Forward
0 new messages