New RSAM-SSAM App compatible with Ringserver / Earthworm
125 views
Skip to first unread message
Julian Peña
Jan 19, 2023, 7:37:00 PM1/19/23
to Earthworm Community Forum
Hi,
Just wanted to share with you a new RSAM-SSAM application compatible with EarthWorm via Ringserver.
Graphs can be made for very large periods of time as long as the wave server can handler the load. The application can connect to FDSN Dataselect, Seedlink and Winston servers.
This is pretty much a work in progress, so feedback is appreciated.
Julian.
Victor Preatoni
Jan 24, 2023, 9:57:14 AM1/24/23
to Earthworm Community Forum
Hi Julian,
thanks for sharing!. Seems more sophisticated than the Winston RSAM plot.
Just a question, we usually plot RSAM for different frequency bands (eg. 0.1-1Hz ; 2-5Hz; ...). Would your app allow to do that?.
Thanks,
Víctor
Julian Peña
Jan 25, 2023, 8:08:00 AM1/25/23
to Earthworm Community Forum
Hi Victor,
That's not possible right now, however, what you describe is data pretty much already available within the ssam part, so I think it shouldn't be too difficult to add.
Would you mind sharing a couple of graphs of what you have right now?, I don't have access to a Winston server.
Julian Peña
Jan 25, 2023, 8:08:05 AM1/25/23
to Earthworm Community Forum
Hi Victor,
On Tuesday, January 24, 2023 at 8:57:14 AM UTC-6 Victor Preatoni wrote:
Victor Preatoni
Jan 25, 2023, 10:47:50 AM1/25/23
to Earthworm Community Forum
Hi Julian,

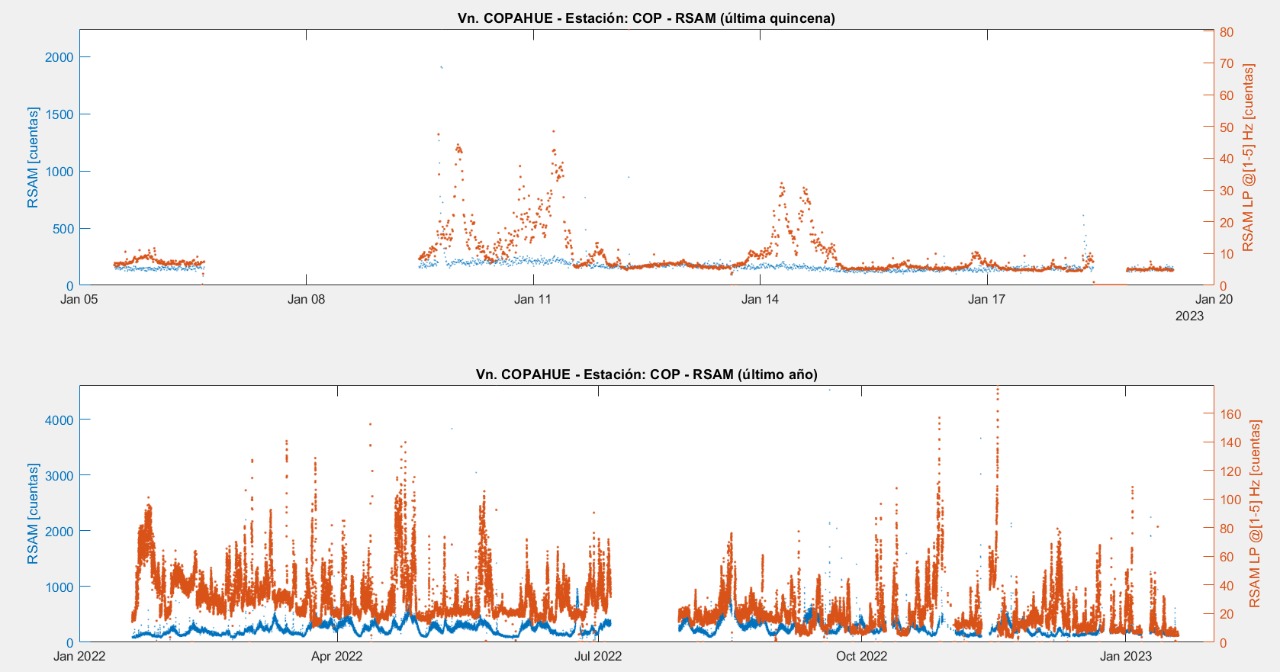
This is the kind of RSAM graphs we generate weekly to analyze volcano behavior. The first plot is last 15 days, with two datasets: unfiltered data, and filtered (1Hz to 5Hz) data.
The second plot is last 365 days, same unfiltered data and 1-5Hz filtered.
Do you think would be possible to adapt your module to this?. Maybe the SSAM computation for 365 days will be very heavy...

Julian Peña
Jan 25, 2023, 8:08:07 PM1/25/23
to Earthworm Community Forum
I think something like that is possible starting from the already generated ssam data, let me think about it.
Regarding the ssam graph for 1 year, that was actually my use case!, you can see a 1 year graph on the repo readme, it took my laptop about 5 minutes to make that graph.
I have generated graphs for much larger periods of time ... BUT, if your datasource is a Winston server then please be cautious, I don't think Winston can handle that kind of loads. Unless you have a very good wave server (FDSN or SeedLink), don't try this on a production machine, instead, you can set up a separate FDSN dataselect server such as this one and use it to generate graphs as large as you want.
Victor Preatoni
Jan 27, 2023, 8:32:34 AM1/27/23
to Earthworm Community Forum
Great, thanks!
Let me know if I can help testing something.
By the way, are you currently working at the SGC?
Thanks
Victor
Julian Peña
Jan 29, 2023, 8:09:08 PM1/29/23
to Earthworm Community Forum
Sure, no problem.
Used to work there, I'm actually open to work.
Julian.
Kevyn Enrique Pineda Ortiz
Sep 19, 2025, 4:40:54 PM9/19/25
to Earthworm Community Forum
Eh, I just configured RSAM-SSAM.
It works really well.
I was wonderin if it possible to obtain the plot for old data doing the requests in FDSN WS or Winston.
Thanks!
Julian Peña
Sep 23, 2025, 4:06:03 PM9/23/25
to earthwo...@googlegroups.com
Yes, it is possible, just go to:
your_rsam_server:19090/customAs long as the data is in your FDSN, Winston or SeedLink server, it should work.
--
--
You received this message because you are subscribed to the Google
Groups "Earthworm Community Forum" group.
To post to this group, send an email to earthwo...@googlegroups.com
To unsubscribe from this group, send an email to
earthworm_for...@googlegroups.com
For more options, visit this group at
http://groups.google.com/group/earthworm_forum?hl=en
---
You received this message because you are subscribed to the Google Groups "Earthworm Community Forum" group.
To unsubscribe from this group and stop receiving emails from it, send an email to earthworm_for...@googlegroups.com.
To view this discussion visit https://groups.google.com/d/msgid/earthworm_forum/214396e8-8842-4358-9e1b-f9d50ecd1edan%40googlegroups.com.
Kevyn Enrique Pineda Ortiz
Sep 24, 2025, 4:11:26 PM9/24/25
to Earthworm Community Forum
It worked.
Thank you very much for your help!
Reply all
Reply to author
Forward
0 new messages
