Is Google workload traces bandwidth small? Or did I do something wrong?

123 views
Skip to first unread message

Edward Edberg

unread,
Aug 31, 2022, 5:22:38 PM8/31/22
to DynamoRIO Users
Hi everyone,

I'm analyzing the google traces. I found that the average bandwidth of all workloads is less than 1GB. I think it is too small for a big company like Google. Is it really this small? Or maybe I did something wrong?

*Sample bandwidth from the charlie workload
Screen Shot 2022-08-31 at 2.14.10 PM.png

Derek Bruening

unread,
Sep 1, 2022, 12:30:00 PM9/1/22
to Edward Edberg, DynamoRIO Users
More information on how you are computing your numbers might help: it looks like these plots are each of just one software thread; are you asking about just one thread in isolation?  Also, the tracing methodology's overhead inflates real time, so the timestamps would be closer together in actual execution.

--
You received this message because you are subscribed to the Google Groups "DynamoRIO Users" group.
To unsubscribe from this group and stop receiving emails from it, send an email to dynamorio-use...@googlegroups.com.
To view this discussion on the web visit https://groups.google.com/d/msgid/dynamorio-users/8d51b0a2-6022-4f01-935e-ee504569ac4an%40googlegroups.com.

Edward Edberg
unread,
Sep 1, 2022, 1:38:21 PM9/1/22
to Derek Bruening, DynamoRIO Users
I plot them for each thread id. Yes, I'm asking for just one thread in isolation.

Here's how I get the plot:
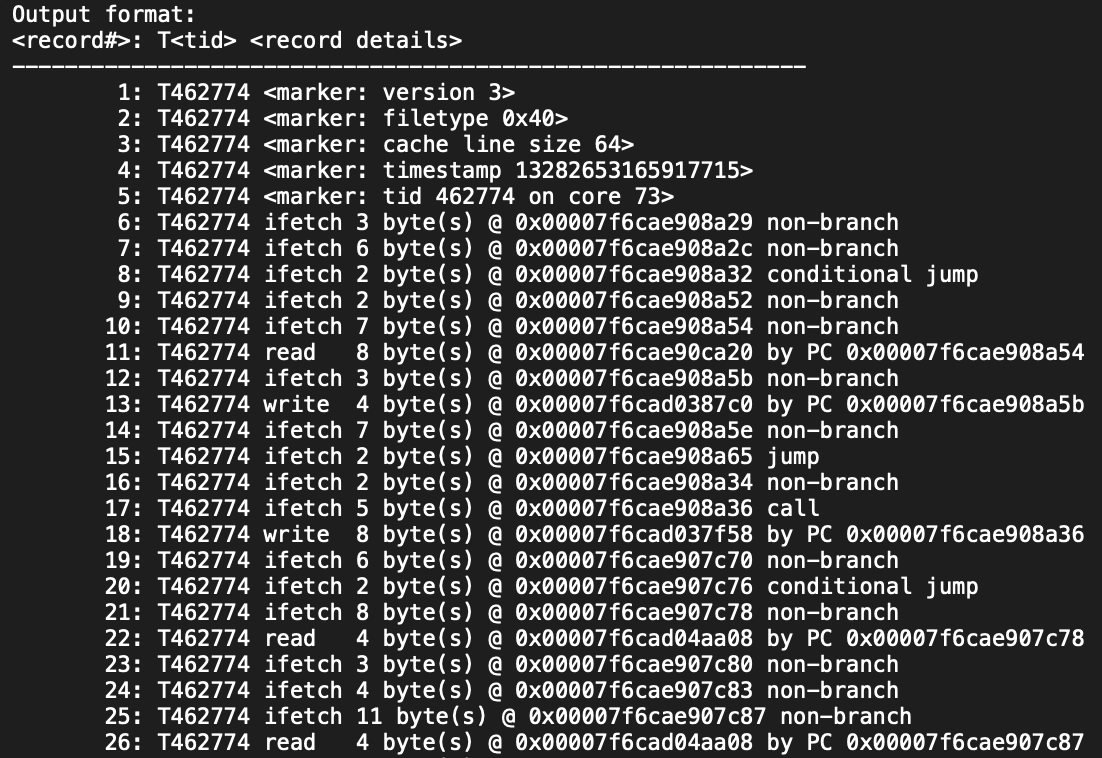
First, I convert the memtrace.gz files to txt file with this code "~/dynamorio/build/bin64/drrun -t drcachesim -simulator_type view -infile {path_input} >& {path_output}".
The output file looks like this.
Screen Shot 2022-09-01 at 10.25.47 AM.png
Next, I sum all the bytes related to the read instruction for every second (Even though I can't split them accurately per one second). That's how I got the read bandwidth and plot it.
Am I doing it correctly?
  

Derek Bruening

unread,
Sep 2, 2022, 2:43:12 PM9/2/22
to Edward Edberg, DynamoRIO Users
Converting to text and processing text is not an efficient (or supported: the view tool output is for humans and it could change without anyone considering that a compatibility change) way to process traces: better to use the analysis tool interface (https://dynamorio.org/sec_drcachesim_newtool.html) and operate directly on the binary format.

Still not sure what you're expecting when looking at just one thread in an application with thousands of threads.  Also note that workloads may not be running completely by themselves.

Edward Edberg

unread,
Sep 11, 2022, 9:29:11 PM9/11/22
to Derek Bruening, DynamoRIO Users
Thanks for the insight. I'm still new to these tools.
Is there any sample code to merge/sync traces together? 

Derek Bruening

unread,
Sep 12, 2022, 12:50:45 PM9/12/22
to Edward Edberg, DynamoRIO Users
On Sun, Sep 11, 2022 at 9:29 PM Edward Edberg <edward.ed...@gmail.com> wrote:
Thanks for the insight. I'm still new to these tools.
Is there any sample code to merge/sync traces together? 

The documentation I sent earlier at https://dynamorio.org/sec_drcachesim_newtool.html discusses the serial mode which interleaves all threads together.  See also drcachesim's -cpu_scheduling flag.

Yunho Jin

unread,
Sep 15, 2022, 3:34:55 PM9/15/22
to DynamoRIO Users
Hi all,
I have a question about how you measured time. Did you just multiply the number of instructions with CPI? Or is there a time measuring tool?

Derek Bruening

unread,
Sep 16, 2022, 11:16:32 AM9/16/22
to Yunho Jin, DynamoRIO Users
If you're asking about the timestamp records, did you already look at the documentation which precisely explains the timestamp value?

Yunho Jin

unread,
Sep 16, 2022, 1:55:12 PM9/16/22
to DynamoRIO Users

I wasn't aware of that document. Thanks for sharing!

Derek Bruening

unread,
Sep 16, 2022, 2:55:45 PM9/16/22
to Yunho Jin, DynamoRIO Users
FTR, a link to this documentation was included in the original Google Workload Traces announcement.

Edward Edberg

unread,
Sep 18, 2022, 2:25:39 AM9/18/22
to Derek Bruening, Yunho Jin, DynamoRIO Users
Hi Derek,

This time I interleave all threads together and run the analyzer. So far, the delta folder is running just fine.
But it didn't work for whiskey and charlie. Any advice?
Screen Shot 2022-09-17 at 11.20.49 PM.png

Edward Edberg

unread,
Sep 18, 2022, 3:43:41 AM9/18/22
to Derek Bruening, Yunho Jin, DynamoRIO Users
When I filtered the traces (only use files that are greater than 2 MB), it works. Still not sure why the code won't run with all files.

Charlie
Total Size: 18.73 GB - 4842 files
Total Size: 18.14 GB - 265 files

Whiskey
Total Size: 9.66 GB - 1352 files
Total Size: 9.47 GB - 309 files

Lei Wang

unread,
Sep 19, 2022, 4:39:12 AM9/19/22
to DynamoRIO Users
I am curious which command can help to interleave all threads and tigger the analyzer.  Which tools can be used?

Derek Bruening

unread,
Sep 19, 2022, 1:41:33 PM9/19/22
to Edward Edberg, Yunho Jin, DynamoRIO Users
I can't reproduce this problem: interleaving for whiskey works fine in my test as shown below.
Did you check file permissions, dump the first few binary records manually (https://dynamorio.org/page_debug_memtrace.html#autotoc_md134) as a sanity check?

After moving *.csv* to a separate directory (these should have been posted that way) so just the *.memtrace.gz are in the trace-1/ dir:
$ /usr/bin/time bin64/drrun -t drcachesim -indir whiskey/trace-1/ -simulator_type view -sim_refs 1000000 > OUT 2>&1

$ tail OUT

   999995: T426717 ifetch       3 byte(s) @ 0x0000000022d23064 non-branch

   999996: T426717 ifetch       3 byte(s) @ 0x0000000022d23067 non-branch

   999997: T426717 ifetch       3 byte(s) @ 0x0000000022d2306a non-branch

   999998: T426717 ifetch       2 byte(s) @ 0x0000000022d2306d conditional jump

   999999: T426717 ifetch       4 byte(s) @ 0x0000000022d2306f non-branch

  1000000: T426717 read         8 byte(s) @ 0x000005b8629fbe30 by PC 0x0000000022d2306f

View tool results:

         743730 : total instructions

$ grep 14505 OUT

     3631: T14505 <marker: version 3>

     3632: T14505 <marker: filetype 0x40>

     3633: T14505 <marker: cache line size 64>

    14505: T426724 read         8 byte(s) @ 0x000005b879b04060 by PC 0x0000000022ba838b

   114505: T426724 ifetch       4 byte(s) @ 0x0000000021d7ab62 non-branch

   145050: T426724 pref-r-L3    1 byte(s) @ 0x000005babdfb4800 by PC 0x0000000021d7ab1a

   145051: T426724 ifetch       8 byte(s) @ 0x0000000021d7ab1d non-branch

   145052: T426724 read         8 byte(s) @ 0x000005ba35fa77b8 by PC 0x0000000021d7ab1d

   145053: T426724 ifetch       3 byte(s) @ 0x0000000021d7ab25 non-branch

   145054: T426724 ifetch       4 byte(s) @ 0x0000000021d7ab28 non-branch

   145055: T426724 ifetch       3 byte(s) @ 0x0000000021d7ab2c non-branch

   145056: T426724 ifetch       4 byte(s) @ 0x0000000021d7ab2f non-branch

   145057: T426724 ifetch       3 byte(s) @ 0x0000000021d7ab33 non-branch

   145058: T426724 ifetch       3 byte(s) @ 0x0000000021d7ab36 non-branch

   145059: T426724 ifetch       4 byte(s) @ 0x0000000021d7ab39 non-branch

   214505: T426724 read         8 byte(s) @ 0x000005ba35fa75f8 by PC 0x0000000022ba83ae

   314505: T426724 ifetch       3 byte(s) @ 0x0000000021d7b79a non-branch

   414505: T426724 <marker: function #3>

   514505: T426717 ifetch       5 byte(s) @ 0x00000000210f9b12 non-branch

   614505: T426719 ifetch       3 byte(s) @ 0x00000000223cf5d4 non-branch

   714505: T426724 read         1 byte(s) @ 0x000005b83d8d0906 by PC 0x0000000021604cf0

   814505: T426719 <marker: function argument 0x8>

   914505: T426716 ifetch       2 byte(s) @ 0x000000002181d081 conditional jump

Lei Wang

unread,
Sep 20, 2022, 6:42:31 AM9/20/22
to DynamoRIO Users
I also use google trace as an example.  Now I hit similar problem under charlie. I keep that folder only contains the memtrace file and trigger the cache simulation. 
That file is small (156 bytes).

Failed to open 17571657100049929577.941065.memtrace
Capture.PNG

Derek Bruening

unread,
Sep 20, 2022, 1:02:15 PM9/20/22
to Lei Wang, DynamoRIO Users
Please see the earlier reply which applies here too: Did you check file permissions?  Did you dump the first few binary records manually (https://dynamorio.org/page_debug_memtrace.html#autotoc_md134) as a sanity check?  Not sure why  you've un-compressed the file but that should still work.  As you would expect, all these files open fine on our tests.  Please provide more diagnostics and details when reporting problems, such as providing the head of the records to show there is no problem with the local file.

Lei Wang

unread,
Sep 20, 2022, 9:39:28 PM9/20/22
to DynamoRIO Users
I used the released version from gitlab. I suppose it should be built with gz as it works with gz file when -infile used. The local issue is a little weird.  For google trace, there are four folders.  After uncompression, the -indir switch works well with delta folder.  For the other three, it always prompt that error. I compared the file permission. All of them are 755. I will try dump the first few binary code to check whether the file is ok.

Edward Edberg

unread,
Sep 21, 2022, 4:58:35 PM9/21/22
to Lei Wang, DynamoRIO Users
Hi everyone,

I processed google memory trace delta and whiskey folder. After combining all threads per workload, I found that the delta and whiskey trace lasted only for around 50 seconds.
Here's the bandwidth data: (The plots attached below)
Delta - Read Bandwidth: ~200 MB/s
Delta - Write Bandwidth: ~100 MB/s

Whiskey - Read Bandwidth: ~225 MB/s
Whiskey - Write Bandwidth: ~140 MB/s

Is it correct? I just want to make sure.

delta.Read.bandwith.pdf
whiskey.Read.bandwith.pdf
whiskey.Write.bandwith.pdf
delta.Write.bandwith.pdf
Reply all
Reply to author
Forward
0 new messages