Second Y axis on Dygraph
324 views
Skip to first unread message

Glimmer
May 7, 2021, 3:49:51 AM5/7/21
to dygraphs-users
Hi All,
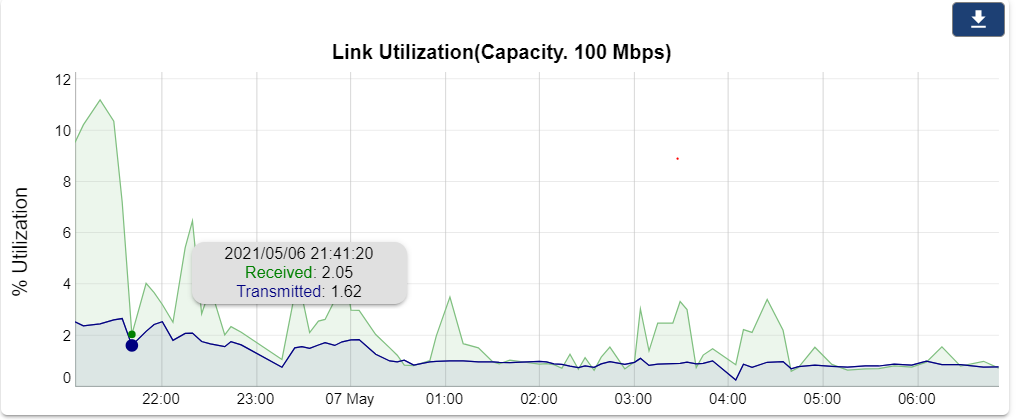
I wanted to show second y axis on left side itself, but I don't want to map with data points.
My current graph is like this
I wanted to add one more yaxis beside %Utilization.
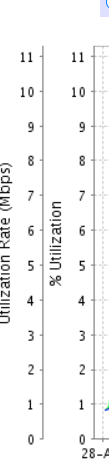
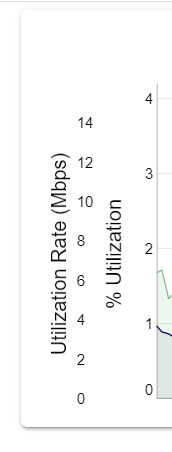
I want this to be look like below
Could u please some one help how to achive this in dy graph.

Bánhidi István
May 8, 2021, 2:58:19 AM5/8/21
to dygraph...@googlegroups.com
Hi Glimmer,
It is not possible or not that simple because there is no option for this yet. Possibly you can use CSS selectors for y2 axis but this is just one another y axis.
If you want to add more than two Y axes then you have to write your own modification/module for Dygraph. Another possibility is use two or more Dygraph horizontally shifted on each other but synchronized for make visible the second, third and so on y axes. You have to play with this idea.
G00Đ ŁucK
Istvan
--
You received this message because you are subscribed to the Google Groups "dygraphs-users" group.
To unsubscribe from this group and stop receiving emails from it, send an email to dygraphs-user...@googlegroups.com.
To view this discussion on the web visit https://groups.google.com/d/msgid/dygraphs-users/e85c5b0f-d802-4c72-98ee-1209352d2347n%40googlegroups.com.
Glimmer
May 8, 2021, 4:46:20 AM5/8/21
to dygraphs-users
Hi banhidi
Thanks for reply.
I think just adding on vertical Y-axis is also a good idea. because this second Yaxis is a independent one. So using css can we set the range dynamically of that (vertical line) Y-axis ?
Bánhidi István
May 8, 2021, 5:13:21 AM5/8/21
to dygraph...@googlegroups.com
Oh, no, sorry, I was unperceived. You can reposition by CSS, but you
cannot change the range of axis.
You can use fix range for an axis via Dygraph options.
Interested options for you:
https://dygraphs.com/options.html#Axis%20display
https://dygraphs.com/options.html#independentTicks
https://dygraphs.com/options.html#valueRange
Istvan
You can use fix range for an axis via Dygraph options.
Interested options for you:
https://dygraphs.com/options.html#Axis%20display
https://dygraphs.com/options.html#independentTicks
https://dygraphs.com/options.html#valueRange
Istvan
To view this discussion on the web visit https://groups.google.com/d/msgid/dygraphs-users/ce70bb8a-4017-4909-a0a3-e085b0e2dfe4n%40googlegroups.com.
Glimmer
May 11, 2021, 10:49:48 AM5/11/21
to dygraphs-users
Hi Istvan,
As you suggested I tried to use independentTicks and valueRange here
But I am missing something or doing some mistake. Now here I want to display secondary Yaxis (If possible beside primary Yaxis), which is completely independent of X and primary Yaxis. (graph should not be affected because of secondary Yaxis. It should display as per primary Yaxis).
Might be I am doing silly mistake but could u please suggest what modification required.
Thanks
Bánhidi István
May 11, 2021, 12:20:22 PM5/11/21
to dygraph...@googlegroups.com
Hi,
Please check the modified version on same place.
https://jsfiddle.net/96mg42fh/4/
Modifications:
- Extended the data source with null values, this is required to render the second axis. You have to say which series belongs to which axis in the "series" option.
- Added axisLabelWidth option to move main Y axis to right to create space for Y2 axis.
- Added some other option to make visible the Y2 axis and its grid.
- Added some CSS code for positioning the labels of each axes.
CSS modifications based on px
I hope this is what you want to see ;)
If you have more questions just let me know.
BR
Istvan
Istvan
To view this discussion on the web visit https://groups.google.com/d/msgid/dygraphs-users/68ee7c3e-d2cc-4d05-9616-e05de6529df8n%40googlegroups.com.
Glimmer
May 12, 2021, 4:50:50 AM5/12/21
to dygraphs-users
Perfect !!!
Thanks Istvan !!! I can able to replicate on my code.
Is there any option is dygraph which create axis line as well (for secondary Y-axis) or we need to make changes in CSS only?
Thanks,
Bánhidi István
May 12, 2021, 11:53:47 AM5/12/21
to dygraph...@googlegroups.com
Your welcome!
Unfortunately there is no option for this or more preciously yes you can customize through a few properties of y axes but you can not move to left with your label for example. Y2 axis always on the right side. When you customize y2 axis (color, width, etc.) you will see.
You need to find another solution. This is why I recommended to you try to use two overlapped Dygraphs but shifted horizontally on the same page. First graph started on left 0px and while second graph left: 100px or something like this and don't forget to synchronize them!
Istvan
To view this discussion on the web visit https://groups.google.com/d/msgid/dygraphs-users/d9916914-7c23-4f60-98ac-4f6e85b53252n%40googlegroups.com.
Reply all
Reply to author
Forward
0 new messages