Data on 3 levels (year, quarter, month)
30 views
Skip to first unread message

fhl....@gmail.com
Jul 14, 2017, 12:17:05 PM7/14/17
to DSPL Discussion Forum
Hello
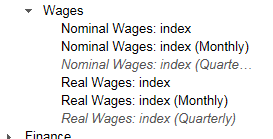
I am uploading a dataset that contains 3 levels of aggregation (year, quarter and month)
When I upload each level in separate they all work fine.
When I upload them all together the Monthly and Quarterly data don't display correctly and some indicators will display as italic in Google Public Data UI (see attached image)
Does anyone faced a similar issue and was able to fix?
Thanks
Rodrigo

Omar Benjelloun
Jul 14, 2017, 4:15:52 PM7/14/17
to DSPL Discussion Forum
Hi Rodrigo,
Unfortunately, PDE does not support showing data from different time granularities in the same dataset at the moment.
Best,
-Omar
--
You received this message because you are subscribed to the Google Groups "DSPL Discussion Forum" group.
To unsubscribe from this group and stop receiving emails from it, send an email to dspl-discuss...@googlegroups.com.
For more options, visit https://groups.google.com/d/optout.
Message has been deleted
Message has been deleted
Omar Benjelloun
Mar 8, 2018, 3:38:30 PM3/8/18
to dspl-d...@googlegroups.com, Anas
Hi there,
Please limit posts on this group to DSPL-related discussions.
Thanks,
-Omar
On Thu, Mar 8, 2018 at 3:35 PM <hamzaf...@gmail.com> wrote:
hello thanks
Reply all
Reply to author
Forward
0 new messages