Connectometry results
45 views
Skip to first unread message

Pedro Henrique
Aug 28, 2021, 11:26:08 AM8/28/21
to DSI Studio
Hello Frank!
I did the Connetometry analysis and I would like to check if the results are correct.
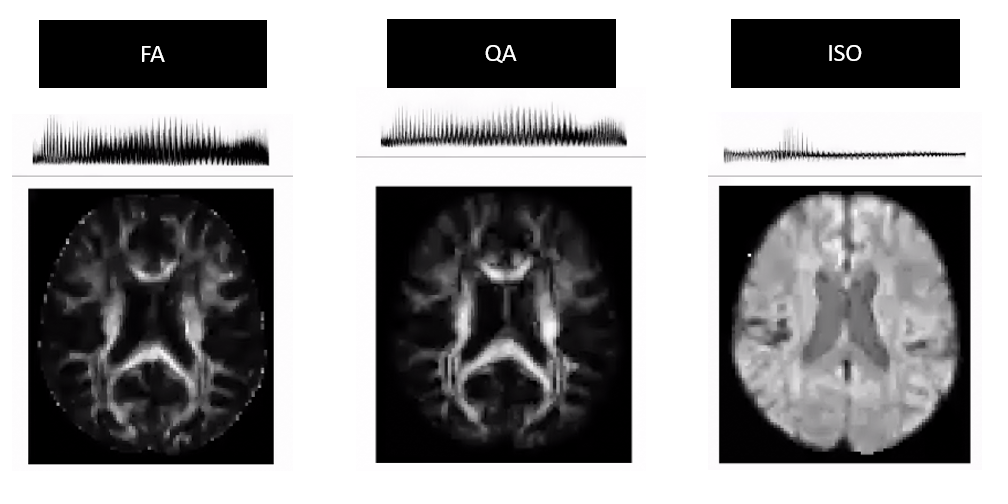
1. I created databases using FA, QA, and ISO indexes. For the FA and QA indices, I could get relevant results. However, when I used the ISO index, I couldn't find results, although I expected to find results with the ISO index. I checked the acquisition parameters, outliers and I didn't find anything that could indicate problems. You mentioned that it could be because the images were probably acquired on different scanners, which I checked and doesn't seem to be the case either. I checked each database and in the attached figure (Connectometry_database) it is possible to notice that for ISO there is almost no signal, which could explain the lack of results. As images are obtained with a 1.5 T scanner, low b value, and single shell, can this be a justification? If I try the traditional tractography method (Fiber tracking), I shouldn't expect better results either, right?
2. Regarding databases with FA and QA indexes, I would like to check if the results are correct or if there is something to be fixed. For the graph ldstcorrect.t2.fdr0.05.fdr (with FA database), the FDR value for the negative values goes to 1, leaving only statistically significant results for positive correlations (ldstcorrect.t2.fdr0.05.pos_corr.dist, see it attached). When I check the result for the QA database, using the same regression model, both statistically significant positive and negative results appear (ldstcorrect.t2.nqa.fdr0.05.fdr, see it attached). How to explain two related metrics exhibiting this behavior? Can I have something wrong with my data?
3. When I open the FA database to check tracts from Connectometry analysis and plot the color bar, only names like QA, NQA, GFA appear. Is this normal?

Frank Yeh
Aug 28, 2021, 12:48:29 PM8/28/21
to dsi-s...@googlegroups.com
1. I created databases using FA, QA, and ISO indexes. For the FA and QA indices, I could get relevant results. However, when I used the ISO index, I couldn't find results, although I expected to find results with the ISO index. I checked the acquisition parameters, outliers and I didn't find anything that could indicate problems. You mentioned that it could be because the images were probably acquired on different scanners, which I checked and doesn't seem to be the case either. I checked each database and in the attached figure (Connectometry_database) it is possible to notice that for ISO there is almost no signal, which could explain the lack of results. As images are obtained with a 1.5 T scanner, low b value, and single shell, can this be a justification?
Yes, ISO from low b value may only capture free water diffusion.
If I try the traditional tractography method (Fiber tracking), I shouldn't expect better results either, right?
Yes.
2. Regarding databases with FA and QA indexes, I would like to check if the results are correct or if there is something to be fixed. For the graph ldstcorrect.t2.fdr0.05.fdr (with FA database), the FDR value for the negative values goes to 1, leaving only statistically significant results for positive correlations (ldstcorrect.t2.fdr0.05.pos_corr.dist, see it attached). When I check the result for the QA database, using the same regression model, both statistically significant positive and negative results appear (ldstcorrect.t2.nqa.fdr0.05.fdr, see it attached). How to explain two related metrics exhibiting this behavior? Can I have something wrong with my data?
QA and FA have different biophysical meanings: http://dsi-studio.labsolver.org/Manual/diffusion-mri-indices#TOC-How-to-interpret-QA-and-FA-results
3. When I open the FA database to check tracts from Connectometry analysis and plot the color bar, only names like QA, NQA, GFA appear. Is this normal?
It is likely a bug. The "QA" derived should be the FA.
I will fix it
Frank
--
You received this message because you are subscribed to the Google Groups "DSI Studio" group.
To unsubscribe from this group and stop receiving emails from it, send an email to dsi-studio+...@googlegroups.com.
To view this discussion on the web visit https://groups.google.com/d/msgid/dsi-studio/6e1ae442-779e-4b9b-902d-aaa6b5a176den%40googlegroups.com.
Reply all
Reply to author
Forward
0 new messages