Can I remove regions blow threshold?
17 views
Skip to first unread message

이익성
May 5, 2021, 9:36:01 AM5/5/21
to DSI Studio
Thank you for great toolbox.
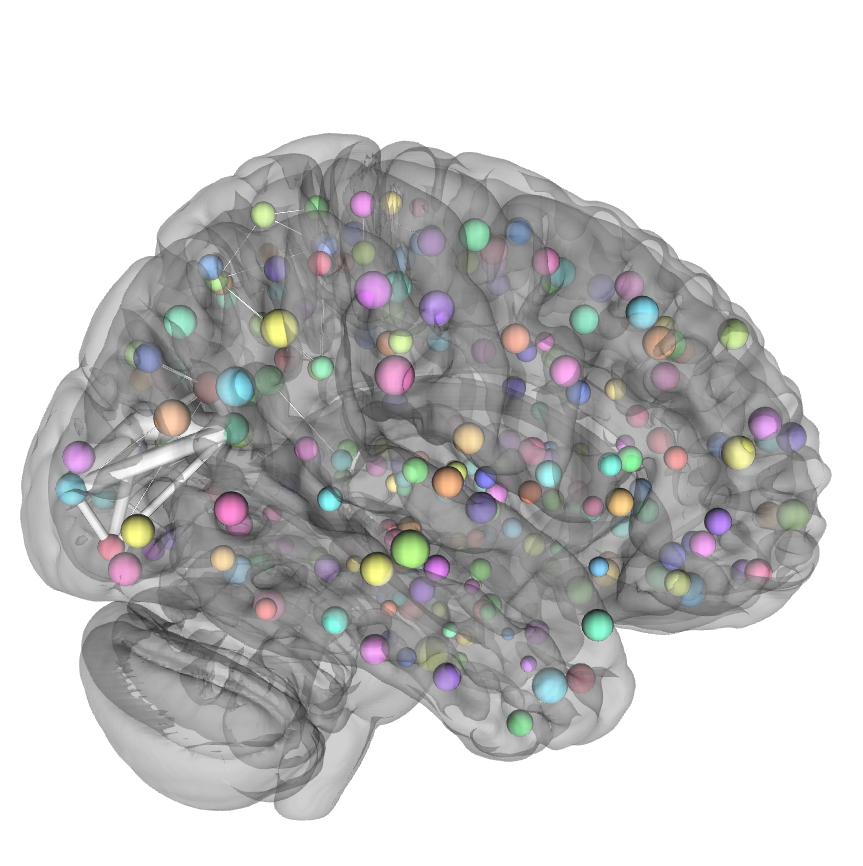
I'm working on group connectometry. After group comparison, graph visulization was succeeded by creating a connectivity matrix. However, all ROIs that do not exceed the threshold are displayed in the results. Is there a way to remove the remaining regions, leaving only meaningful ROIs? Or I have to do it manually?

Frank Yeh
May 5, 2021, 9:41:51 AM5/5/21
to dsi-s...@googlegroups.com
I am adding this feature request to my to-do list and will let you
know once available.
Frank
On Wed, May 5, 2021 at 9:36 AM 이익성 <eek...@gmail.com> wrote:
>
> Thank you for great toolbox.
> I'm working on group connectometry. After group comparison, graph visulization was succeeded by creating a connectivity matrix. However, all ROIs that do not exceed the threshold are displayed in the results. Is there a way to remove the remaining regions, leaving only meaningful ROIs? Or I have to do it manually?
>
>
> --
> You received this message because you are subscribed to the Google Groups "DSI Studio" group.
> To unsubscribe from this group and stop receiving emails from it, send an email to dsi-studio+...@googlegroups.com.
> To view this discussion on the web visit https://groups.google.com/d/msgid/dsi-studio/f6da0633-727a-4167-a048-cb9c64f7266bn%40googlegroups.com.
know once available.
Frank
On Wed, May 5, 2021 at 9:36 AM 이익성 <eek...@gmail.com> wrote:
>
> Thank you for great toolbox.
> I'm working on group connectometry. After group comparison, graph visulization was succeeded by creating a connectivity matrix. However, all ROIs that do not exceed the threshold are displayed in the results. Is there a way to remove the remaining regions, leaving only meaningful ROIs? Or I have to do it manually?
>
>
> You received this message because you are subscribed to the Google Groups "DSI Studio" group.
> To unsubscribe from this group and stop receiving emails from it, send an email to dsi-studio+...@googlegroups.com.
> To view this discussion on the web visit https://groups.google.com/d/msgid/dsi-studio/f6da0633-727a-4167-a048-cb9c64f7266bn%40googlegroups.com.
이익성
May 5, 2021, 10:24:26 AM5/5/21
to DSI Studio
Thank you for prompt and kind reply.
I'm looking forward to update.
Sincerely.
2021년 5월 5일 수요일 오후 10시 41분 51초 UTC+9에 Frank Yeh님이 작성:
Frank Yeh
May 5, 2021, 10:34:07 AM5/5/21
to dsi-s...@googlegroups.com
This feature is now available as a default setting.
Please update DSI Studio (today's version) and see if it works for you.
Please update DSI Studio (today's version) and see if it works for you.
이익성
May 5, 2021, 11:12:37 AM5/5/21
to DSI Studio
It works perfectly!
It will be of great help to me if you consider applying the same option to 'label rendering' in the next update.
2021년 5월 5일 수요일 오후 11시 34분 7초 UTC+9에 Frank Yeh님이 작성:
Frank Yeh
May 5, 2021, 11:15:00 AM5/5/21
to dsi-s...@googlegroups.com
I see the point. will soon update it.
Frank
> To view this discussion on the web visit https://groups.google.com/d/msgid/dsi-studio/34deac93-3929-43b9-9510-07294f960877n%40googlegroups.com.
Frank
Frank Yeh
May 5, 2021, 11:24:42 AM5/5/21
to dsi-s...@googlegroups.com
Updated to the Windows version. See if it works for you.
If you are using the Mac version, please let me know and I will commit
its update.
If you are using the Mac version, please let me know and I will commit
its update.
Reply all
Reply to author
Forward
0 new messages