Issues Moving from Group Connectometry to Analyses Outside of DSI-Studio.
25 views
Skip to first unread message

Jamie Hanson
Jul 15, 2021, 10:59:47 AM7/15/21
to DSI Studio
Hello DSI-Studio colleagues,
I was running into a potential issue and wanted to see if others in the group had thoughts about best next steps for troubleshooting.
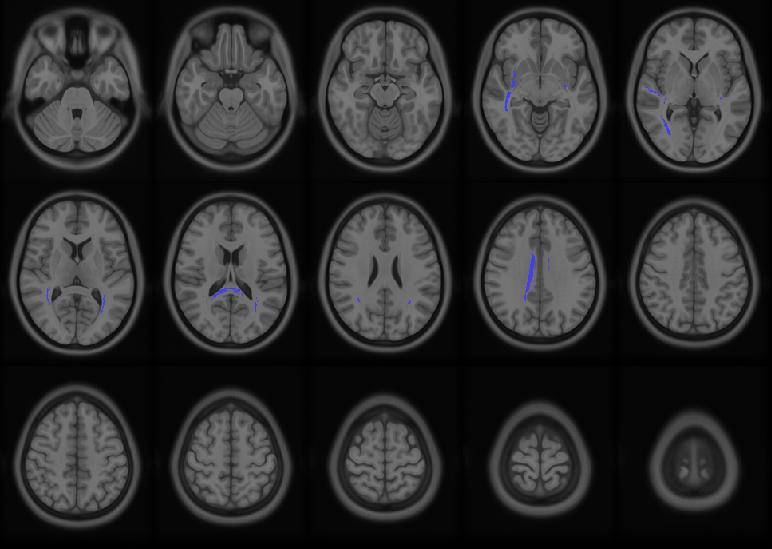
In brief, my group reconstructed ~90 subjects with QSDR using all the default/standard settings. We completed some group connectometry using a recent version of DSI-studio (July 13th build). We opened the group connectometry database, loaded variables of interest (just one independent variable) and ran analyses as shown in different tutorials (q<.1, t=2.5, length=20; we bumped up the permutations and the pruning to 6000 and 6 but everything was fairly standard).
There's a few tracts that emerged (see the attached map) and then I attempted to isolate significant tracts for analysis "outside" of DSI-studio (and this is where I may be doing something incorrect). I loaded the .tt.gz results, went to (Tracts Misc) -> (Recognize and Cluster), and then output individual tract files of the results. My hope was to use those tracts analogous to an ROI in functional imaging. I then extracted individual subject values for each tract (using QA and NQA) and attempted to "replicate" the results I find from the group connectometry analysis of interest.
Interestingly, the relations drop a good bit (when data is extracted and analyzed in R). Outside of DSI-studio, the associations have a t-range of 1-1.9; however, the connectometry analyses in DSI-studio had a t-threshold of 2.5 (so I was expecting the effects to be a bit stronger). I know I am aggregating signal across the whole tract, but I thought the statistical relations would have been a bit higher. The isolated tracts were significant with whole-brain analyses (at a higher threshold).
Have others run into this? Is (Recognize and Cluster) a major issue? Is there another/better way to isolate and reduce down group connectometry for use outside of DSI-studio (like in R or python, etc.)? I basically want to create tract of interest files based on the whole connectometry analyses (and hope to have roughly similar results inside or outside of DSI-studio). Any advice is much appreciated!
Thanks much, and all the best,
Jamie.
Jamie.

Frank Yeh
Jul 15, 2021, 11:33:45 AM7/15/21
to dsi-s...@googlegroups.com
Hi Jamie,
Connectometry has something in addition.
In your case, 6000 permutation means DSI Studio conducted 6000 permutations to generate a null distribution of the fiber distribution. This null distribution curve is often smooth enough. However, when estimating the non-permuted condition, the resulting fiber distribution is often not smooth and very sensitive to T-score variation at each voxel unless more than hundreds or more subjects were used.
To cope with this issue, DSI Studio applied bootstrap resampling to both permuted and none-permutated conditions.
The resulting analysis was in fact a comparison between 6000 resamplings with permutation and 6000 resamplings without permutation. This generates smooth and converged distribution for both permuted and nonpermuted conditions, and the FDR estimation is much more accurate.
Therefore, the tract generated using thresholding T=2.5 is only a result generated from one of the 6000 resampling cases. The corresponding T score from all subjects will always be lower.
Hope this helps clarify the discrepancy.
Best,
Frank
--
You received this message because you are subscribed to the Google Groups "DSI Studio" group.
To unsubscribe from this group and stop receiving emails from it, send an email to dsi-studio+...@googlegroups.com.
To view this discussion on the web visit https://groups.google.com/d/msgid/dsi-studio/0f872886-c672-42e5-b66a-4c20f69b6c0fn%40googlegroups.com.
Jamie Hanson
Jul 15, 2021, 3:55:43 PM7/15/21
to dsi-s...@googlegroups.com
Dear Frank,
Thanks for the quick response and clarification!
Two follow-ups:
1) Would more permutations improve the "agreement" between original (inside DSI-studio) and derived (outside) statistical values? Or would other settings (i.e., increasing stat thresholds)?
2) Will the discrepancy be reduced with larger n's (like 200+)?
Many thanks again, and all the best,
Jamie.
Jamie.
---
Jamie Hanson
Assistant Professor, Psychology
Research Scientist, Learning Research and Development Center
University of Pittsburgh
Personal website: jamiehanson.org
I support the Union of Pitt Faculty
Jamie Hanson
Assistant Professor, Psychology
Research Scientist, Learning Research and Development Center
University of Pittsburgh
Personal website: jamiehanson.org
I support the Union of Pitt Faculty
You received this message because you are subscribed to a topic in the Google Groups "DSI Studio" group.
To unsubscribe from this topic, visit https://groups.google.com/d/topic/dsi-studio/fseCOmLwBpU/unsubscribe.
To unsubscribe from this group and all its topics, send an email to dsi-studio+...@googlegroups.com.
To view this discussion on the web visit https://groups.google.com/d/msgid/dsi-studio/CAG_QrtKQvVzeyfznvKtLu0eAvUdqsmZ2iR_euswSixyAx0vPqA%40mail.gmail.com.
Frank Yeh
Jul 15, 2021, 4:03:04 PM7/15/21
to dsi-s...@googlegroups.com
1) Would more permutations improve the "agreement" between original (inside DSI-studio) and derived (outside) statistical values? Or would other settings (i.e., increasing stat thresholds)?
No, likely the opposite because there are more resampling instances.
2) Will the discrepancy be reduced with larger n's (like 200+)?
Yes. metrics derived from bootstrap resampling will be asymptotically close to those from the population when n is large.
Best regards,
Frank
To view this discussion on the web visit https://groups.google.com/d/msgid/dsi-studio/CAN8Mcn8cPTiuCZr5ZXijZ88eNBivNPFOCkA1XyGU19JSH9fh8g%40mail.gmail.com.
Reply all
Reply to author
Forward
0 new messages