Group connectometry : extract mean dti_fa value of significant results
215 views
Skip to first unread message

Jean Kim
Mar 31, 2021, 3:16:48 AM3/31/21
to DSI Studio
Dear Dr. Yeh,
Hello, I performed group connectometry (thank you for the great tool btw), and it shows both positive correlational pathways.
To extract the mean FA value of each subject to analyze correlation with behavioral measure, I followed <http://dsi-studio.labsolver.org/Manual/diffusion-mri-connectometry#TOC-Scatter-plots> this description saying load connectometry database and significant tracts, then extract tract statistics to see mean FA value of each subject and more.
However, it shows something unacceptable (?) or hard interpretation values of FA, which I attached to this conversation.
As you can see, positively correlated tracts' mean FA shows very low in the majority. Well, fornix generally shows a lower FA value than other regions, but still I think it is too low.
Is this an error? Or should I recalculate in different ways?
Thank you in advance.
Sincerely,
Jean

Frank Yeh
Mar 31, 2021, 8:34:02 AM3/31/21
to dsi-s...@googlegroups.com
Is you connectometry database created from "qa" or "fa"?
It is likely that it is from "qa" which has values depending on the b-table.
Frank
--
You received this message because you are subscribed to the Google Groups "DSI Studio" group.
To unsubscribe from this group and stop receiving emails from it, send an email to dsi-studio+...@googlegroups.com.
To view this discussion on the web visit https://groups.google.com/d/msgid/dsi-studio/eddfa64e-4049-4700-9726-16db3ce41cc4n%40googlegroups.com.
Jean Kim
Apr 1, 2021, 2:30:57 AM4/1/21
to DSI Studio
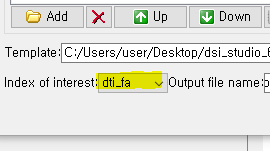
If I get your questions correctly, I believe I chose dti_fa to create a connectometry database.
On Step C2: Create a Connectometry Database, I loaded all of qsdr fib files, then I selected dti_fa in Index of Interest and created the database.
I attached the output filename screenshot and what I chose on Step C2.
Thanks a lot for your quick response.
Sincerely,
Jean
Frank Yeh
Apr 1, 2021, 8:53:39 AM4/1/21
to dsi-s...@googlegroups.com
I see. You may check the original FIB file and see if the FA values are correct.
FA can be lower if there is a partial volume of free water or either acquisitions problems.
Frank
To view this discussion on the web visit https://groups.google.com/d/msgid/dsi-studio/1b32c0dc-001f-4ea6-aab8-20c4c19f3f3fn%40googlegroups.com.
Jean Kim
Apr 2, 2021, 1:54:16 AM4/2/21
to DSI Studio
Dear Dr.Yeh,
Thank you again for your advice.
I loaded the original .fib.gz file used for reconstructing qsdr files to create connectometry database in Step T3:FIber tracking.
Then, I opened the significantly positive tracts, and ran the statistics.
It shows FA values of 0.35, which is definitely different from a previous value I got, 0.07. ( In the previously attached 'report.csv', subject is 'MR_001_0088975_DTI mean_dti_fa').
Should I extract FA values from the original fib.gz files to analyze correlation between behavioral measures? Would it be acceptible?
Sincerely,
Jean
Frank Yeh
Apr 2, 2021, 9:17:45 AM4/2/21
to dsi-s...@googlegroups.com
Yes, it should also work.
Frank
To view this discussion on the web visit https://groups.google.com/d/msgid/dsi-studio/601a9d03-7902-4299-bc21-1d72ce90c203n%40googlegroups.com.
Jean Kim
Apr 21, 2021, 7:30:56 AM4/21/21
to DSI Studio
Dear Dr.Yeh,
I have tried to export the significant FA values of the connectometry results (pos_corr.tt.gz) from the original FIB file instead of qsdr.
I realized that "pos_corr.tt.gz is registered to hcp1065, but my original FIB file is not aligned to hcp 1065.
So it is quite hard to get the correct FA values.
Is there any suggestion to extract FA values on significant tracts of the connectometry results (pos_corr.tt.gz)?
Sincerely,
YaeJi Kim
Frank Yeh
Apr 21, 2021, 8:57:53 AM4/21/21
to dsi-s...@googlegroups.com
Hi YaeJi,
You may try this to see if it works for you:
http://dsi-studio.labsolver.org/Manual/diffusion-mri-connectometry#TOC-Scatter-plots
Best,
Frank
> To view this discussion on the web visit https://groups.google.com/d/msgid/dsi-studio/f959427a-232e-4229-a05d-24ffcf035d7en%40googlegroups.com.
You may try this to see if it works for you:
http://dsi-studio.labsolver.org/Manual/diffusion-mri-connectometry#TOC-Scatter-plots
Best,
Frank
Jean Kim
Apr 22, 2021, 3:28:58 AM4/22/21
to DSI Studio
Dear Dr. Yeh,
I believe that is exactly what I have done before using the original fib file. (as you can find in the earlier conversation in this thread).
There I got an issue having extremely low FA values (I was using dti_fa when reconstructing connectometry database), which is quite unacceptable to interpret ( i.e. FA value of 0.05 on Fornix_L).
You suggest me to load pos_corr.tt.gz file on the original fib file, but as I questioned, the alignment is far apart.
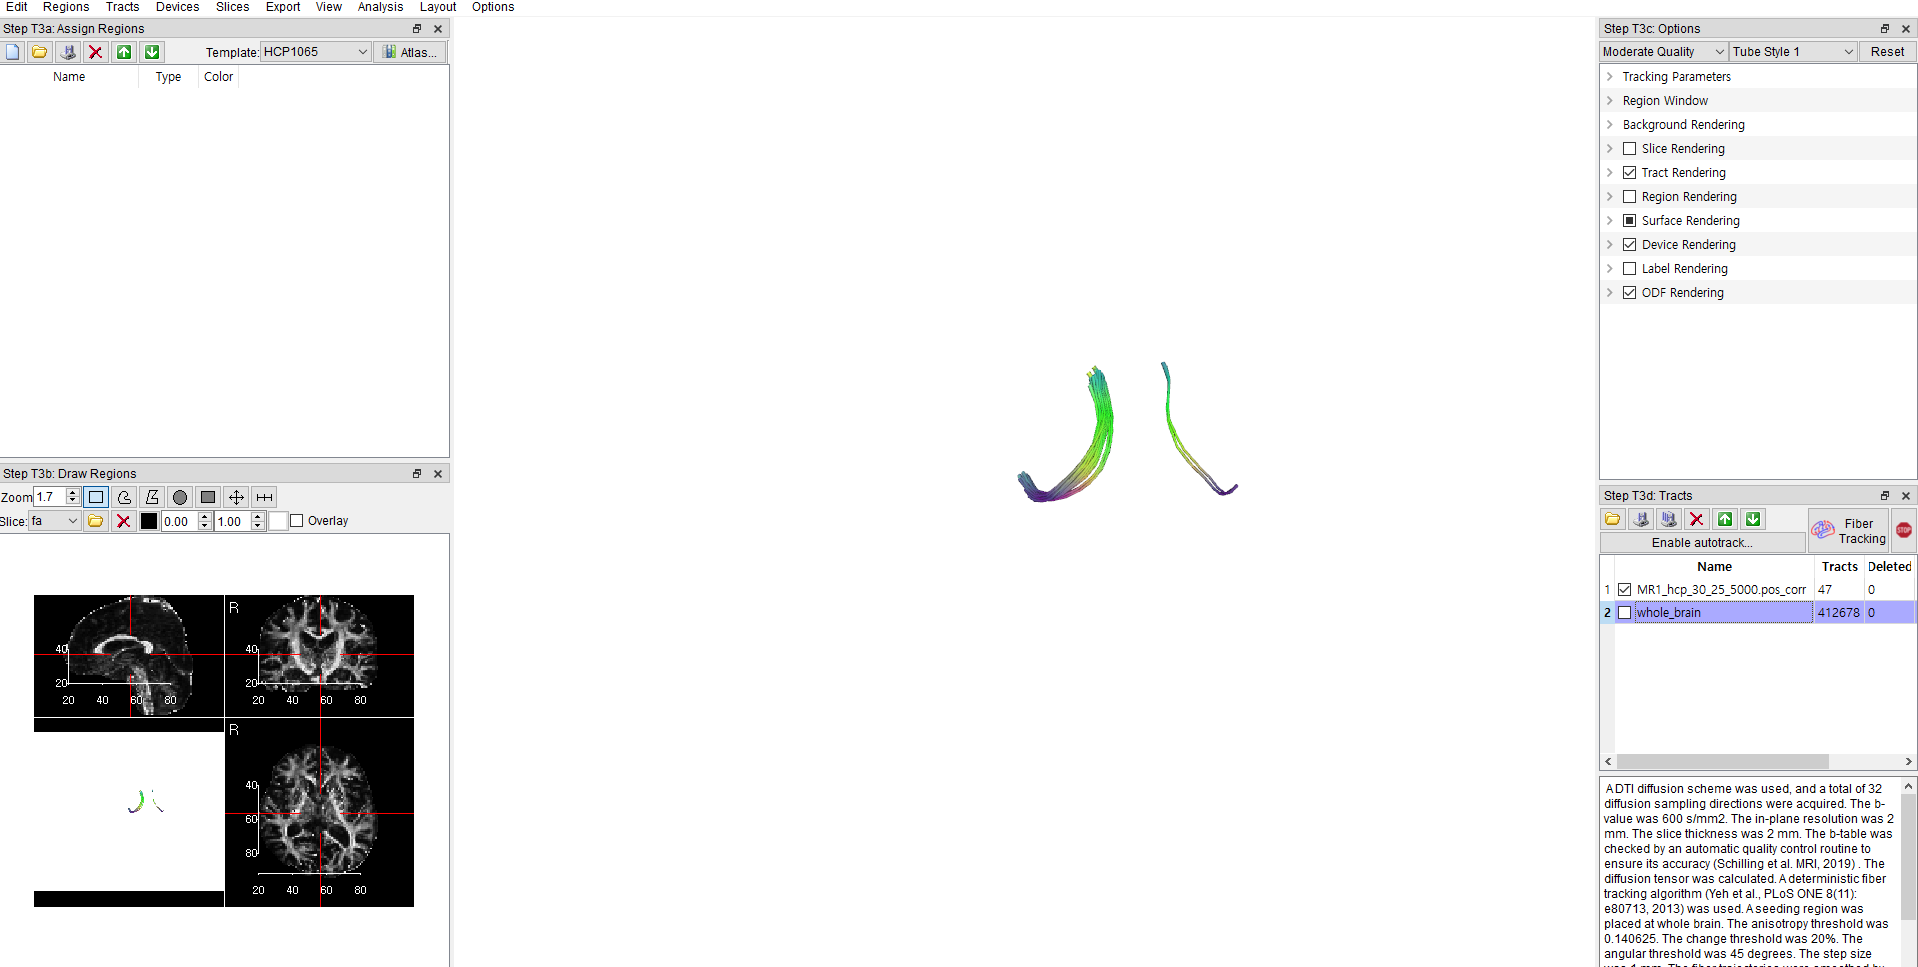
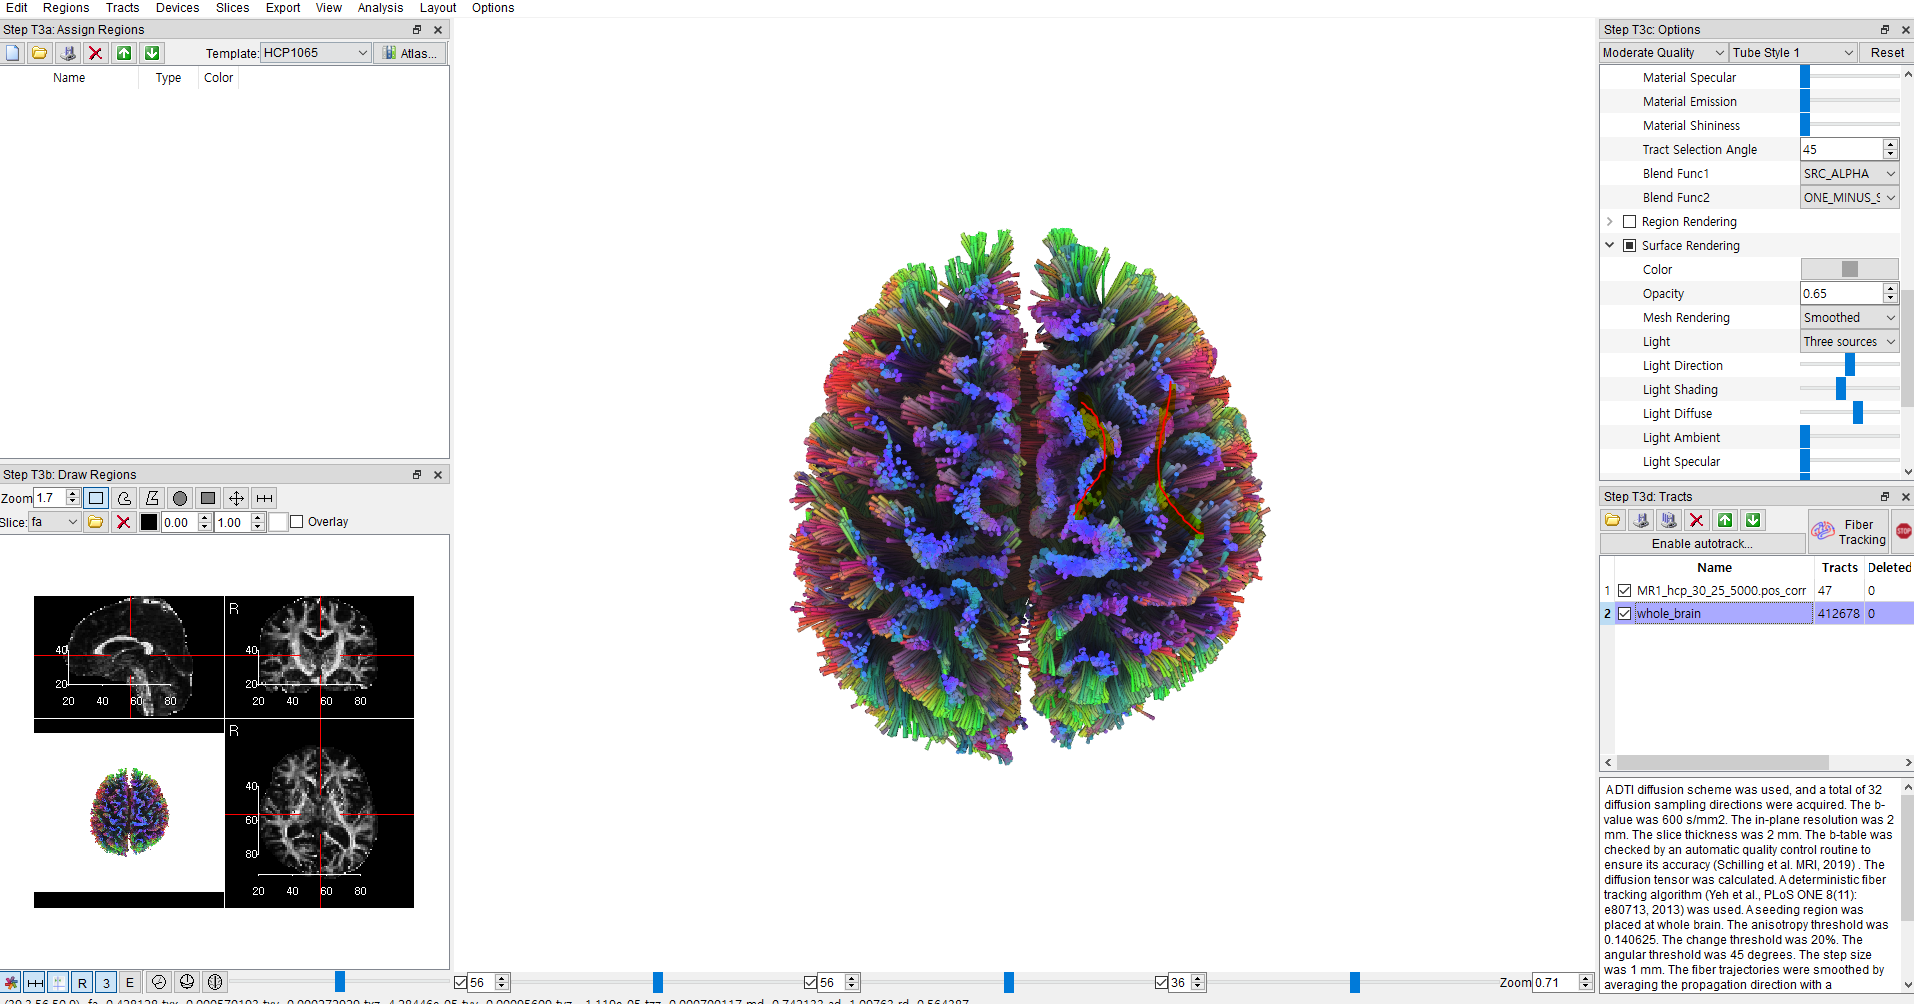
I attached the screenshot of the registration issue when fiber tracking.
'wholebrain.PNG' shows the whole brain fiber tracking of the original fib file, and 'pos_corr.PNG' is the significant results from the connectometry analysis.
- I marked where 'pos_corr.tt.gz' lies on the whole brain image as red.
Sincerely,
Jean
Frank Yeh
Apr 22, 2021, 9:38:18 AM4/22/21
to dsi-s...@googlegroups.com
The cord tracks are in the template space, not subjects native space.
You will need to follow the documentation I sent you to get the right fa values.
Best regards
Frank
To unsubscribe from this group and stop receiving emails from it, send an email to dsi-studio+unsubscribe@googlegroups.com.
To view this discussion on the web visit https://groups.google.com/d/msgid/dsi-studio/eadf44b8-10e6-4d53-9f72-fd4de37f138cn%40googlegroups.com.
Reply all
Reply to author
Forward
0 new messages