Tract profile for Segment of Tract
28 views
Skip to first unread message

Paula Johnson
Jan 3, 2023, 11:32:48 PM1/3/23
to DSI Studio
Hi Prof. Yeh,


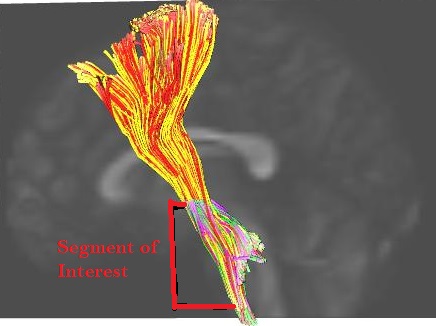
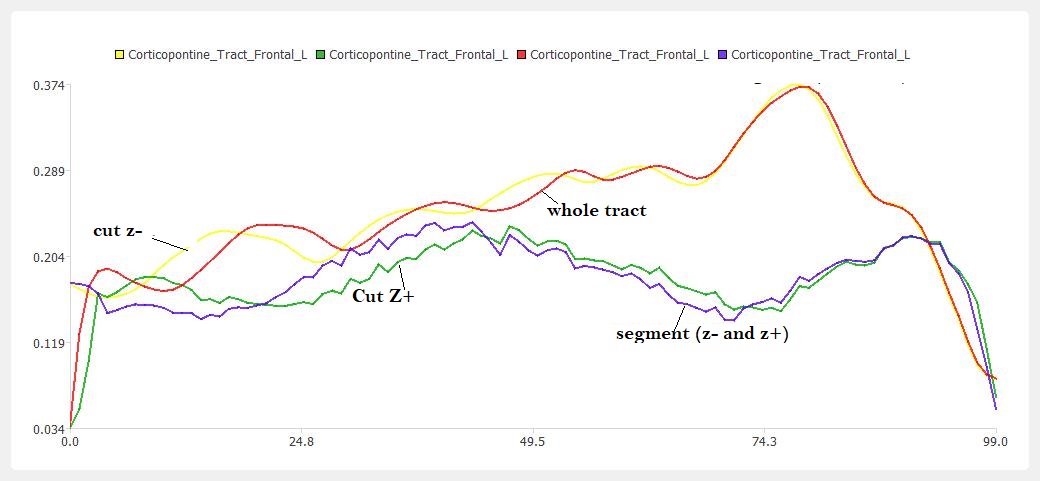
We are interested in the qa values for just a segment of a tract. We will compare this segment across two groups (about 20 in each). I sliced the same tract on a single subject in different ways to understand how the profiles changes. In the attached images there are 4 versions of the same tract for the same subject- red is the whole tract, yellow is sliced so that the bottom is removed, green is sliced so that the top is removed, and purple is the with both the top and bottom removed so that only the area of interest remains. The 4 colors on the profile graph correspond to the image.
1) Can you help me understand why when the top of the tract is removed the profile is jagged (green and purple lines)?
2) Is it better to use a subset of the whole tract profile, say 30 of the 100 values; or can I use the 100 values for the defined segment? (This assuming that I'm going about the solution correctly--am I going at it correctly or did I misunderstand what the profile is?)
Thank you.
Paula

Fang-Cheng Yeh
Jan 5, 2023, 9:15:01 AM1/5/23
to dsi-s...@googlegroups.com
1) Can you help me understand why when the top of the tract is removed the profile is jagged (green and purple lines)?
The smoothness depends on the length if along tract profile is used.
2) Is it better to use a subset of the whole tract profile, say 30 of the 100 values; or can I use the 100 values for the defined segment? (This assuming that I'm going about the solution correctly--am I going at it correctly or did I misunderstand what the profile is?)
I would suggest using QSDR to construct data to the same standard space.
Then the profile should use the z direction.
Best
Frank
Thank you.Paula
--
You received this message because you are subscribed to the Google Groups "DSI Studio" group.
To unsubscribe from this group and stop receiving emails from it, send an email to dsi-studio+...@googlegroups.com.
To view this discussion on the web visit https://groups.google.com/d/msgid/dsi-studio/830a1064-cdf1-496d-a45c-a2fc8ee6ce8an%40googlegroups.com.
Reply all
Reply to author
Forward
0 new messages