Tract Profiles
35 views
Skip to first unread message

Paula Johnson
Oct 21, 2021, 2:04:58 PM10/21/21
to DSI Studio
Hi Dr. Yeh,
Thank you for adding the directional information at the bottom of the tract profile window. Unfortunately, I have two issues with it.
1) The directional information does not always appear in the window. I haven't noticed a pattern of when it does and when it doesn't show up, but it is missing more often than not.
2) I'm not sure I understand the references and their values. Are they starting points? Do you mind explaining them?
I am using the Windows version of DS Studio downloaded on 5/25/21.
I've attached pictures for reference. (One has the CI showing, but selecting it doesn't seem to make a difference in whether or not the directional information appears.)
Thanks.
Paula Johnson
University of Utah

Frank Yeh
Oct 21, 2021, 2:23:33 PM10/21/21
to dsi-s...@googlegroups.com
Hi Paula,
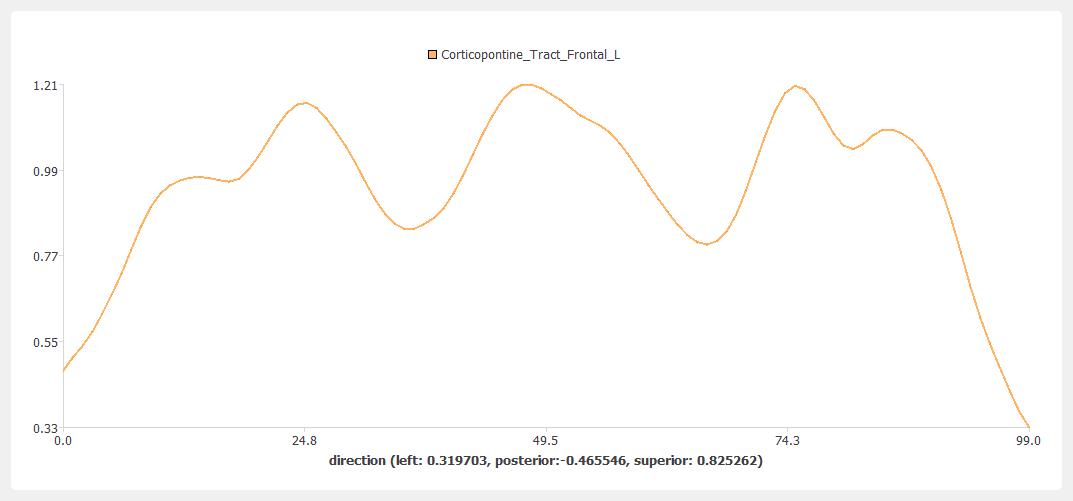
Sorry for the unclear labeling, the y-axis is the value for the metrics (e.g. FA, QA...etc.), whereas the x-axis is spatial coordinates or length (e.g. your figures), depending on which reference frame you selected.
I will modify DSI Studio to provide correct labeling in the future.
Best regards,
Frank
--
You received this message because you are subscribed to the Google Groups "DSI Studio" group.
To unsubscribe from this group and stop receiving emails from it, send an email to dsi-studio+...@googlegroups.com.
To view this discussion on the web visit https://groups.google.com/d/msgid/dsi-studio/ca2fb672-0d2a-49d6-9ed8-9f03ce0dfc61n%40googlegroups.com.
Paula Johnson
Oct 21, 2021, 2:56:27 PM10/21/21
to dsi-s...@googlegroups.com
Thank you for the prompt reply.
My apologies, but I'm still unclear. Does "Left: #, Posterior: #, Superior: #" at the bottom of the screen mean that point 1 on the x-axis coordinates with the most left, posterior, superior point (and their values e.g. qa on my figure) on the tract? As we move toward point 99 on the x-axis, do the y-values reflect the qa values (in my case) at the most right, anterior, inferior point on the tract?
What I really just want to get at, is which direction along the tract do the indices on the x-axis represent, e.g. in my figure as we move from 1 to 100 on the x-axis are we moving cortical toward pontine or pontine toward cortical along the WM tract? Or am I totally misunderstanding what the x-axis represents?
Paula
You received this message because you are subscribed to a topic in the Google Groups "DSI Studio" group.
To unsubscribe from this topic, visit https://groups.google.com/d/topic/dsi-studio/1s6GNxKRFMQ/unsubscribe.
To unsubscribe from this group and all its topics, send an email to dsi-studio+...@googlegroups.com.
To view this discussion on the web visit https://groups.google.com/d/msgid/dsi-studio/CAG_Qrt%2Bu%2Be2b1RYFEmz1ThXaYEgKRb467sRCEAs3aBQT2iswpg%40mail.gmail.com.
Frank Yeh
Oct 21, 2021, 3:06:26 PM10/21/21
to dsi-s...@googlegroups.com
The "along-track" profile stretches all tracks into straight lines of
the same length.
The x-axis is the along-track length, but the length value can be
coordinated in two different directions.
Here larger values in the x-axis will choose the direction that goes
toward left-posterior-superior-orientations
> To view this discussion on the web visit https://groups.google.com/d/msgid/dsi-studio/CAJvZrGfu-%3DpkWZPkGNcfuwbkw4U_sZEqVC8Rk%3DR-VctEDmM_KQ%40mail.gmail.com.
the same length.
The x-axis is the along-track length, but the length value can be
coordinated in two different directions.
Here larger values in the x-axis will choose the direction that goes
toward left-posterior-superior-orientations
Reply all
Reply to author
Forward
0 new messages