import csv as cross functional flowchart
244 views
Skip to first unread message

Quezako
Mar 10, 2022, 4:54:53 AM3/10/22
to diagrams.net Q&A
Hello,

I'm looking for an alternative to Visio Data Visualizer, by exporting my Excel data as .csv file, then import it to diagrams.net.
But I could not find a way to import it as a cross functional flowchart.
I have specific rows and columns for each element and I want to specify them while importing.
Here is the resut in Visio, with all the ending elements in purple in the middle.
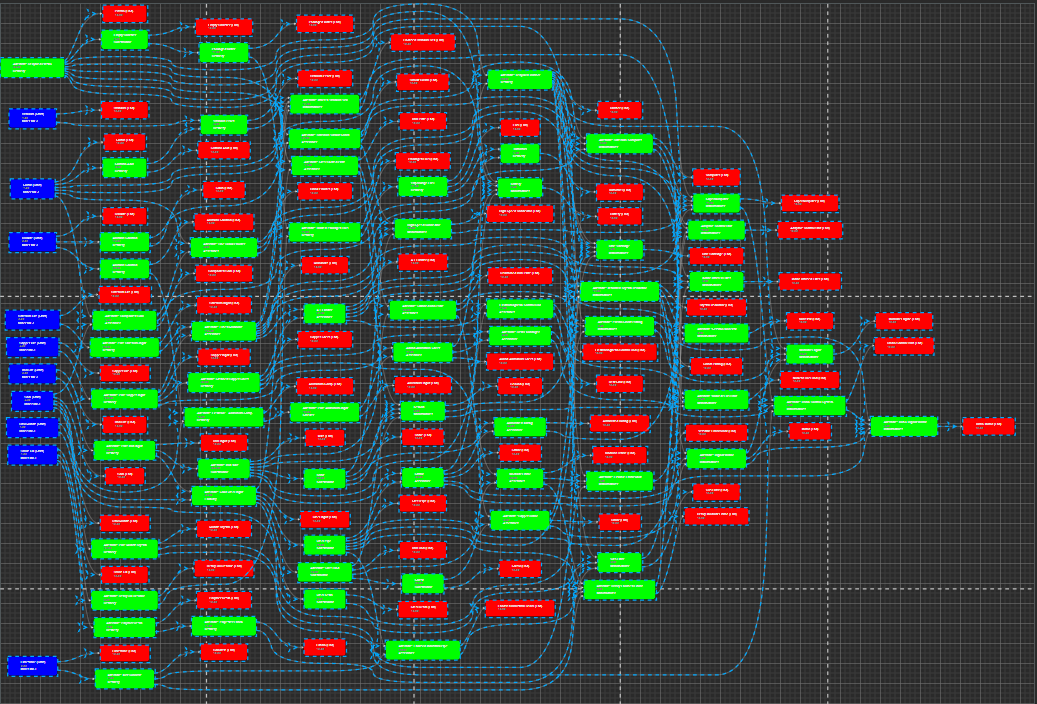
Then the actual result with diagrams.net csv import.
The axis are inverted (top is on the left), but this is not important. the most important is that I want to group all the red elements in the same column.
I've tried to use the parent option, but I did not manage to make it work.
I've checked the examples at https://drawio-app.com/import-from-csv-to-drawio/
But I couldn't find a cross functional example.
Do you know if this is possible?
Quezako
Mar 10, 2022, 5:32:35 AM3/10/22
to diagrams.net Q&A
I would like to achieve something like the organigram template:

Quezako
Mar 11, 2022, 2:36:04 AM3/11/22
to diagrams.net Q&A
Hello,
Is there any solution with CSV, or do I have to import as XML, maybe?
Reply all
Reply to author
Forward
0 new messages