Understanding Goodness of fit and its implications for estimations
87 views
Skip to first unread message

Tim Awbery
Apr 24, 2023, 7:39:29 AM4/24/23
to distance-sampling
Hi,
When using the gof_ds function I notice that there is some divergence between the Empirical and fitted Cumulative Distribution Function at lower values (see attached image). I believe this is due to a relatively high number of zero-distance values where an animal was seen in front of the vessel and its bearing was recorded to zero (most likely rounded by observers).
Tim
I am fitting a detection function based on a vessel survey and following visual inspection and the AIC score I have selected a Hazard-rate with Hermite polynomial adjustments as my function of choice.
To the best of my knowledge, in theory, the model (just) satisfies the Distance sampling Cramer-von Mises test: Test statistic = 0.422462 p-value = 0.0630683.
I appreciate from other threads in this group and wider reading that there is no simple fix to spikes at or near zero-distance (other than to redo the fieldwork) but I struggled to find information (and am struggling to get my head around) what implications this is likely to have on any abundance/density calculations made moving forward.
Any help or suggested literature would be greatly appreciated.
Thanks in advance.
Best wishes,
Tim

Eric Rexstad
Apr 24, 2023, 8:33:01 AM4/24/23
to Tim Awbery, distance-sampling
Greetings Tim:
Ah yes, the "spike at zero" challenge. You've presented your analysis according to the standard rules (create models, use GOF to retain models consistent with the data (retaining those whose significance level exceeds some Type I error rate threshold, use AIC
for model selection).
If this was the full extent of distance sampling analysis, we would code those rules into the software and leave little decision making for the human. But there is more to analysis than this. The human must also assess the plausibility of the resulting model.
Plausibility in the sense of whether the detection process has a shape shown by the fitted model.
In most cases with a surplus of detections at zero-distance, the plausibility test is not passed by the fitted hazard rate key function model. What typically occurs this situation is a precipitous decrease in detectability over a fairly short perpendicular
distance range. This results in estimated detection probability of, say, 0.2 at distances of 20-40m. The interpretation of this is for each animal detected at 30m, there are 4 more animals at that distance you failed to detect. This often does not pass the
sniff test.
The further consequence of fitting hazard rate models that "fit this spike" and fall away very rapidly, is the overall estimate of probability of detecting animals within the truncation distance of the transect is also very small. Because this detection probability
is in the denominator of the classical distance sampling estimator of abundance or density, the resulting estimates are unrealistically large. Stated more simply: your estimated detection probability is too small, causing your estimated abundance or density
to be too large.
Here is a passage from Section 5.2 of Buckland et al. (2015). You can substitute "hazard rate" for "negative exponential" in the following:
Often, assumption failure leads to spiked data, for which there are many detections close to the line or point, with a sharp fall-off with distance. For example, in line transect sampling with poor estimation of distance, many detected animals may be recorded as on the line (zero distance). In such cases, a model selection tool such as AIC might select the negative exponential model because of its spiked shape. However, we should consider whether the negative exponential is a plausible model a priori for a detection function. If all animals on the line are certain to be detected, it is implausible that many animals just off the line will be missed.
What to do in this situation? The choices include a) redo the fieldwork (as you suggest) or b) use a model inconsistent with the data that might more reliably capture the essence of the detection process you are trying to model, perhaps the half normal key
function.
From: distance...@googlegroups.com <distance...@googlegroups.com> on behalf of Tim Awbery <tim.a...@sams.ac.uk>
Sent: 24 April 2023 12:39
To: distance-sampling <distance...@googlegroups.com>
Subject: [distance-sampling] Understanding Goodness of fit and its implications for estimations
Sent: 24 April 2023 12:39
To: distance-sampling <distance...@googlegroups.com>
Subject: [distance-sampling] Understanding Goodness of fit and its implications for estimations
--
You received this message because you are subscribed to the Google Groups "distance-sampling" group.
To unsubscribe from this group and stop receiving emails from it, send an email to distance-sampl...@googlegroups.com.
To view this discussion on the web visit https://groups.google.com/d/msgid/distance-sampling/34e035f8-6daa-48b2-b46a-d94a0a0b287bn%40googlegroups.com.
Tim Awbery
Apr 24, 2023, 10:47:13 AM4/24/23
to distance-sampling
Hi Eric,
Thanks for getting back to me so quickly and for your clear explanations (particularly regarding the relationship between underestimating the detection probability and overestimating the density/abundance - not really sure why I was struggling with that now but thank you for clearing it up).
The data I'm trying to make use of was collected over 17 field seasons so unfortunately redoing the fieldwork isn't really an option (although I will suggest a change in data collection procedure for future fieldwork) which I suppose leave me with option b.
The distance that my estimated detection probability reaches 0.2 in the hazard-rate model has not dipped quite as aggressively as that. It is approximately at 330 metres but given that I'm looking at minke whales this still seems a little on the low side to be missing four animals for every one detected as you suggest (please see attached Hazard-rate.png).
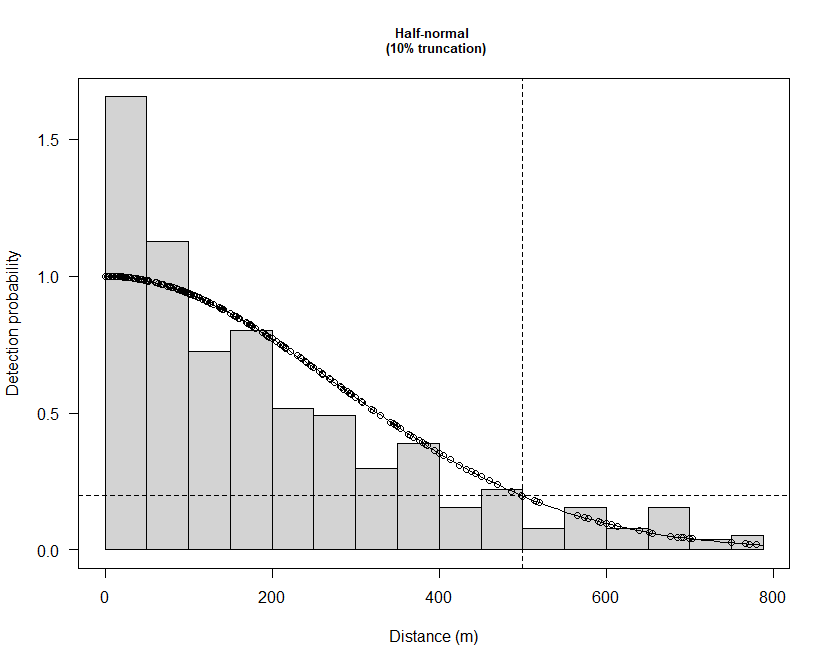
By using the half-normal as the key function as you suggested, this distance extends to ~500 metres (please see attached Half-normal.png) which seems more realistic but at this point feels more like guesswork. Do you have any advice for choosing this more realistic but worse fitting function given that AIC and GOF are of less importance?
In the latter case, the 0-50 metre area of the histogram has an estimated detection probability of 1.6 (please see attached Half-normal.png). Given that we believe that there is an overestimation in the 0 distance is this necessarily a problem?
Additionally, I noticed that there is an option to truncate both on the left and the right in distance software. I wondered if a left truncation was ever used to attempt to address this problem.
Once again, I want to thank yourself for your response to my previous question and yourself and the rest of the distance team for creating such an excellent resource here and on the distance sampling website.
Best,
Tim
Eric Rexstad
Apr 24, 2023, 11:32:07 AM4/24/23
to Tim Awbery, distance-sampling
Tim
Having discounted some of the data, perhaps because of rounding to zero distance, many of the remaining decisions become subjective. Before making those decisions, you might examine the data more closely; rather than using the default histogram plot of the
data, increase the number of bins to get a higher resolution depiction of the data (particularly at small distances). The bin widths of the plots you provided are 50m. That may help in understanding the cause of the spike.
You could consider more severe right truncation (truncate at a value w where g(w)~0.15 with your half normal model), but I would be reluctant to invoke left truncation—to do so would require a decision regarding the appropriate value for left truncation, for
which I have no advice.
From: distance...@googlegroups.com <distance...@googlegroups.com> on behalf of Tim Awbery <tim.a...@sams.ac.uk>
Sent: 24 April 2023 15:47
To: distance-sampling <distance...@googlegroups.com>
Subject: Re: [distance-sampling] Understanding Goodness of fit and its implications for estimations
To: distance-sampling <distance...@googlegroups.com>
Subject: Re: [distance-sampling] Understanding Goodness of fit and its implications for estimations
To view this discussion on the web visit
https://groups.google.com/d/msgid/distance-sampling/44d95a9e-d72f-4db5-b831-6fc546e17302n%40googlegroups.com.
Tim Awbery
Apr 24, 2023, 11:40:14 AM4/24/23
to distance-sampling
Hi Eric,
Tim
Thanks for this. I really appreciate you taking the time to get back to me.
All the best,
Tim

Tiago Marques
Apr 24, 2023, 12:03:10 PM4/24/23
to Tim Awbery, distance-sampling
A minor comment on to of Eric's suggestion, that should also reflect his view of the world, if I have not misinterpreted it. The left truncation enters the category of, if you want, "data salvaging", not really "data analysis" ;), along the lines of the suggestion "use a model inconsistent with the data that might more reliably capture the essence of the detection process you are trying to model, perhaps the half normal key function". Therefore, it is basically something you could do, , expecting to be better off doing it than otherwise, but rather heuristic, that is with no indication of optimality (or even improvement) over doing nothing. Whether it makes sense or not depends on the reality (about the detectability process), which is not known. I actually prefer Eric's suggestion over left truncation, which should always be a last resort, because if done sensibly one might hope to get about the right detection function for the data at hand IF measurement error was absent. The left truncation changes both the detectability component and the encounter rate component, so now you are trying to undo two biases: one induced by measurement error, but a second one induced by a change in the encounter rate in the strip you consider after truncation compared with the original encounter rate. Therefore IMO left truncation becomes really messy, really fast. Left truncation might be more sensible to deal with a scenario in which say you had lower visibility near the line, and hence you post hoc adjust effectively the transect line to be some Y meters away from the actual line (though if that were really the case, you could also use non-monotonically decreasing detection functions too, see e.g. the work of Earl Becker, DOI: 10.1371/journal.pone.0136403). In either case, if you are doing left truncation, then you are making additional assumptions (some more plausible than others) about the both true underlying detection and availability processes, so you should proceed with extreme caution. So I guess in short... don't do left truncation at home folks, even trained professionals can get burnt in the process :) !
To view this discussion on the web visit https://groups.google.com/d/msgid/distance-sampling/7368d9d8-a99b-4e55-bdd9-fc43a3748a4dn%40googlegroups.com.

jjr...@gmail.com
Apr 24, 2023, 5:24:05 PM4/24/23
to distance-sampling
> I believe this is due to a relatively
high number of zero-distance values where an
animal was seen in front of the vessel and its bearing was recorded to
zero (most likely rounded by observers).
If you have reasonable confidence observers were rounding bearings to zero and you can establish a range over which the true bearings likely fell, you could consider smearing the exactly-0 bearings across that range. Looking at your detection function, I'm not sure this would make much of a difference in the end--there doesn't appear to be that much of a spike right at the trackline--but it is another "data salvaging" option you could try. The defense for taking this approach would rest on you having specific knowledge of what went wrong. If you were not confident observers were rounding to exactly zero, or not confident of the range you should smear across, then it might be too sketchy for some folks, or one of the other "salvaging" approaches might be more appropriate. In any case, a significant investment was made to conduct 17 field seasons, and the question should be asked about whether it is better to have an imperfect analysis with a caveat, or no analysis at all. I encourage you not to give up. (And by all means, try to diagnose and fix the problem for future surveys.)
Best,
Jason
Tim Awbery
Apr 25, 2023, 4:59:43 AM4/25/23
to distance-sampling
Thank you Tiago for your additional comments.
Tim
Left truncation wasn't something I had come across in the literature and it appears for good reason!
Best,
Tim
Tiago Marques
Apr 25, 2023, 5:15:40 AM4/25/23
to Tim Awbery, distance-sampling
Eric just reminded me that I have once commented in print about left truncation. In case that helps, this is here:
Marques, T. A. 2016 A comment on Horcajada-Sánchez and Barja (2015): a cautionary tale about left truncation and density gradients in distance sampling Annales Zoologici Fennici 53: 52-54
https://www.jstor.org/stable/43923535
https://www.jstor.org/stable/43923535
In general, I agree with Jason: "it is better to have an imperfect analysis with a caveat" than "no analysis at all". Just be explicit about the assumptions made and discuss the possible implications of their failure.
Cheers,
T
To view this discussion on the web visit https://groups.google.com/d/msgid/distance-sampling/92ef2480-bca1-4ffd-a271-4b8a82c3987fn%40googlegroups.com.
Tim Awbery
Apr 25, 2023, 10:59:08 AM4/25/23
to distance-sampling
Hi Jason,
Given the number of readings at 0 degrees compared to those at 1-5 degrees and 355-359 degrees, I am relatively confident that observers have rounded to zero.
As you said, there has been significant investment in the fieldwork and I will attempt to find the correct method(s) to "salvage" the data.
In any case, I will fully state any assumptions made or caveats used.
I really appreciate the time you've taken to comment and thanks for your encouragement.
Best,
Tim
Tim Awbery
Apr 25, 2023, 11:00:09 AM4/25/23
to distance-sampling
Hi Tiago,
Thanks for sending this across.
Tim
Thanks for sending this across.
As I said to Jason, I really appreciate the time you've taken to comment and thanks for your encouragement.
Best,
Tim
Reply all
Reply to author
Forward
0 new messages