Dealing with outlier locations in camera trap distance sampling

Maik Henrich


Eric Rexstad
Sent: 09 August 2022 17:30
To: distance-sampling <distance...@googlegroups.com>
Subject: [distance-sampling] Dealing with outlier locations in camera trap distance sampling
You received this message because you are subscribed to the Google Groups "distance-sampling" group.
To unsubscribe from this group and stop receiving emails from it, send an email to distance-sampl...@googlegroups.com.
To view this discussion on the web visit https://groups.google.com/d/msgid/distance-sampling/6be37f59-418b-4810-a6ac-cff5669b24cfn%40googlegroups.com.

Stephen Buckland
Adding to Eric’s comments, it seems to me that you cannot make good decisions about the analysis without a good understanding of how the data arose. Even without that point, a very high proportion of detections are within about 5m of the camera. This could be because:
- The vegetation is very thick so that animals have to be close to the camera to be detected.
- Cameras have been preferentially placed for example along animal trails, rather than located randomly, which is required for camera-trap distance sampling.
- The process of measuring distances is somehow biased towards shorter distances, such as would occur if you just used the distance of closest approach for each animal.
- Resting animals were recorded at each snapshot moment, and an animal resting near the camera would generate large numbers of small distances.
- Animals may be attracted to the camera.
If 1, it will be difficult to obtain reliable analyses. Field methods might need to be reviewed. For example if trees block the camera views and they are deciduous, it may be necessary to do surveys after leaf fall. It may be necessary to point cameras in a direction from the point that has a relatively clear view (although there is the potential for this to create bias, for example when a direction has a clear view because it is along an animal trail).
If 2, then camera-trap distance sampling is not going to work.
If 3, and you have the data available, getting distances at snapshot moments as described by Howe et al (2017) will help.
If 4, then exclude resting animals from the analysis, and separately estimate the proportion of time resting.
If 5, do animals respond to the camera only when they are first installed? You could exclude data for the time period that animal behaviour is affected. Or you could exclude data for animals that are seen from the images to be reacting to the camera.
Of course, the explanation for your data may be none of the above!
Steve Buckland
From: 'Eric Rexstad' via distance-sampling <distance...@googlegroups.com>
Sent: 09 August 2022 18:22
To: Maik Henrich <maik.he...@gmail.com>; distance-sampling <distance...@googlegroups.com>
Subject: Re: [distance-sampling] Dealing with outlier locations in camera trap distance sampling
Maik
I'm not sure there is a "statistically proper" solution to your question. Useful insight about one location contributing to the issue; you note 127 detections at that camera station, what do you notice about the distribution of detection distances for that station? I
infer that there were not only many detections, but those detections were at small distances; leading to a shift of the detection distances to the left for all cameras.
You may need to dig more deeply into the images. Is there a suggestion that animals at that station are responding to the camera? I note you have a recent paper (doi: 10.3389/fevo.2022.881502) on behaviour of deer with respect to cameras. You have probably seen the paper by Houa et al. (DOI:10.7717/peerj.13510) discussing animal reactions to camera traps. There may be some insights to draw from their work. Perhaps others on the list will share their thoughts.
From:
distance...@googlegroups.com <distance...@googlegroups.com> on behalf of Maik Henrich <maik.he...@gmail.com>
Sent: 09 August 2022 17:30
To: distance-sampling <distance...@googlegroups.com>
Subject: [distance-sampling] Dealing with outlier locations in camera trap distance sampling
Dear Distance Sampling community,
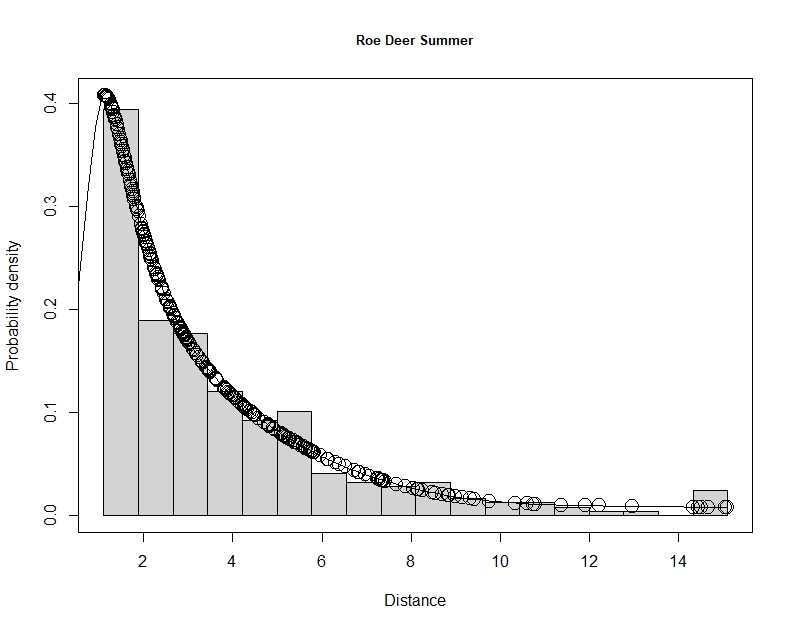
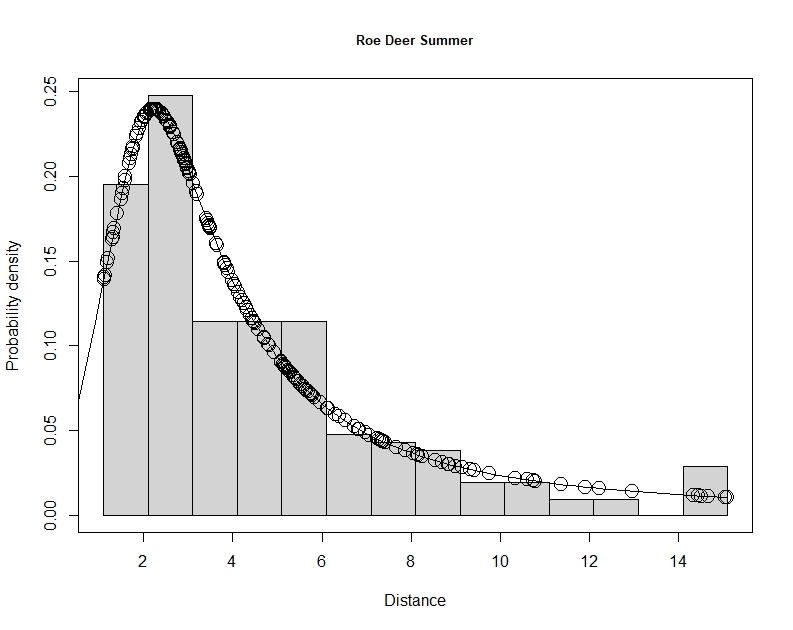
during population density estimation for different ungulate species and seasons, I encountered some cases of unrealistically high estimates, most notably for roe deer in summer. The reason for this was a very small detection probability due to a an excess amount of very small distance estimates. Upon further inspection, I noticed that the inclusion or exclusion of a single camera trap location (128) out of 50 camera trap locations in total had a huge impact on the result. 34% of all distance estimates were recorded at this camera trap location (127 estimates, all other locations had at maximum 46). When camera trap location 128 is included in the dataset, this results in an estimated p of 0.02 and an effective detection radius (EDR) of 2.23 m. When I exclude this camera trap location, p is 0.07 and the EDR is 4 m. I do not know at the moment why so many roe deer were close to the camera trap at location 128 specifically , but it is always possible that there is e.g. a game trail passing very close to the camera trap by chance at one of the camera trap locations.
Detection function with camera trap location 128

Detection function without camera trap location 128
This is obviously a big problem for the reliability of the population density estimates, which are generated based on this dataset. Of course I cannot exclude the "problem location", just because the results make more sense when I do that. However, I could not figure out a proper solution so far.
Do you have any advice on how to deal with such outlier locations in a statistically proper way?
Thanks in advance!
Best,
Maik
--
You received this message because you are subscribed to the Google Groups "distance-sampling" group.
To unsubscribe from this group and stop receiving emails from it, send an email to
distance-sampl...@googlegroups.com.
To view this discussion on the web visit
https://groups.google.com/d/msgid/distance-sampling/6be37f59-418b-4810-a6ac-cff5669b24cfn%40googlegroups.com.
--
You received this message because you are subscribed to the Google Groups "distance-sampling" group.
To unsubscribe from this group and stop receiving emails from it, send an email to
distance-sampl...@googlegroups.com.
To view this discussion on the web visit https://groups.google.com/d/msgid/distance-sampling/DBAPR06MB66946FE2A959B91EEB80CE83EA629%40DBAPR06MB6694.eurprd06.prod.outlook.com.

PABLO PALENCIA MAYORDOMO
Maik Henrich
Dear Eric, Stephen and Pablo,
thanks for your answers! It is true that there are not only a lot of distances at location 128, but also that the distribution of these distances is shifted towards the lower range of the values. I just looked through the photos again and did not find any instances of animals being especially attracted to the camera at this location.
Regarding the different points that were brought up:
1. When installing the camera traps, we made sure that there is no thick vegetation at least up until a distance of 8 m
2. Our camera trap study was based on a 1km² grid of points, from which we randomly selected the camera trap locations
3. We estimated distances for all animals that are visible in the first photo of each 3-photo series (= a snapshot moment). Therefore there should also not be a sampling bias in the distance estimates.
4. In order to restrain the influence of a few cases of animals staying extraordinarily long in the field of view, I truncated these observations. For roe deer in summer that meant that if an animal stayed longer than 9 photo series in the field of view, I would discard the rest of the photo series.
5. We did not observe an extraordinary amount of reactions in the first few days after installing the camera traps. The only behavioral reaction that we sometimes observed was that roe deer paused for a moment to look at the camera trap, but this behavior should not influence the distribution of observation distances (nevertheless it would be the best to remove these snapshot moments for sure).
7. This is probably indeed the problem here. Out of 50 camera trap locations in total, there are only 8 with more than 10 roe deer detections in summer. It seems that at the two locations with the most detections (46%), there is by chance in both cases a game trail passing the camera trap very closeby.
Which kind of stratification would you propose, Pablo?
Any further ideas how to deal with this issue would be of course very welcome!
Thanks again and all the best,
Maik
Stephen Buckland
Maik, yes, camera-trap distance sampling is always prone to the problem of a camera by chance being located next to a spot of high activity. The method works best when animal activity is well-distributed through the habitat. I don’t have a good solution for this problem.
Thanks for your responses on each issue. The only one that raises a possible flag for me is your definition of a snapshot moment. To avoid bias, you need to define these as outlined by Howe et al (2017). The snapshot moments should be defined independently of the animal detections. The simplest option is to have the camera to take a snapshot say every 15 mins, regardless of animal activity. Of course, most images would be empty, so instead, in most studies, the camera only takes images when an animal triggers it. In that case, to avoid bias in detection distances, you still need nominal snapshot moments, and these need to be frequent, say one every two seconds. In that way, any triggering event will be close to a nominal moment, and at least one snapshot moment will occur for any animal that passes in front of the camera. If you just record the first detection distance for each animal that passes in front of the camera, you will get distances that are biased towards zero. It wasn’t clear to me from your response whether this was what you did.
Steve Buckland
To view this discussion on the web visit https://groups.google.com/d/msgid/distance-sampling/9981ce85-79b8-4acb-8ee2-683ff3ab6d53n%40googlegroups.com.
Maik Henrich
Stephen Buckland
Thanks Maik – and sorry for my poor memory! In that case, I agree that the problem is one inherent in camera-trap distance sampling, that if animals have spots of very high activity, the variance in detection rate across cameras can be excessively high. If those spots of activity are very restricted spatially, that makes the problem worse because one of these may be just 1 or 2m from the camera, generating lots of very short distances, which makes it impossible to model the detection function well.
I think the high variability across camera locations is something you have to live with. Stratification may help a little, if you can identify in advance which cameras are likely to detect more animals. The modelling of the detection function is probably something that can be improved, for example by taking the mean distance per independent detection, and using those to fit the detection function model. Or some more formal way to weight the distances according to the number of independent detections. So if you have 15 distances recorded from a single animal pass, each would have a weight of 1/15 when fitting the detection function. Not sure how this might be implemented!
Steve
To view this discussion on the web visit https://groups.google.com/d/msgid/distance-sampling/33b88030-2fb3-4170-9223-6ec2c52f5824n%40googlegroups.com.
Maik Henrich
Stephen Buckland
Maik, in the absence of better solutions, that sounds fine to me.
To view this discussion on the web visit https://groups.google.com/d/msgid/distance-sampling/9794f971-c423-4c9a-9889-4ae73090e7a0n%40googlegroups.com.