Spikes near zero and it effect on the detection function
26 views
Skip to first unread message

Casolyn
Apr 16, 2023, 8:06:50 AM4/16/23
to distance-sampling
Dear Distance sampling group,
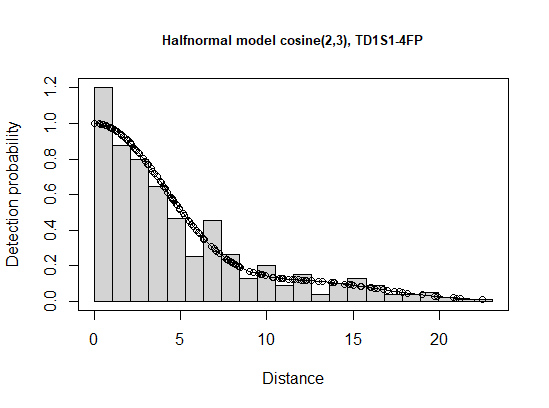
I am performing distance sampling on feral pigeon in an urban environment. In my dataset of the city centre i noticed a spike around the zero to five meter distances due to urban environment density gradient and because of flocking of feral pigeons around the zero distances of the transect line. Which in my model creates a 'spike at zero' bias. As an example i added my chosen model: the halfnormal key function with cosine adjustment.
From research into the method i know that a spikes near zero bias can result in an overestimation of the estimated density and i have tried to find and understand information about this however i dont fully understand it.
Can somebody explain to me why when there is a spike near zero in my dataset this results in a possible overestimation when modelling. in the form of how is the calculation that the model does to estimate a density affected by the spikes near zero bias.
Very much thank you in advance and a nice weekend!
With kind regards,
Casolyn

Duane Diefenbach
Apr 16, 2023, 9:29:17 AM4/16/23
to Casolyn, distance-sampling
Casolyn,
I don’t think it’s the spike per se that is the problem. I assume your transects are sidewalks or roads, which are not random with respect to how pigeons are distributed. You are more likely to find pigeons walking on sidewalks searching for handouts so your transects are located where pigeon densities are highest; hence, you are likely to over estimate pigeon densities.
Note that I would need more information about how you placed your lines, but you allude to the problem when you state, “ due to urban environment density gradient and because of flocking of feral pigeons around the zero distances of the transect line”
Duane
--
You received this message because you are subscribed to the Google Groups "distance-sampling" group.
To unsubscribe from this group and stop receiving emails from it, send an email to distance-sampl...@googlegroups.com.
To view this discussion on the web visit https://groups.google.com/d/msgid/distance-sampling/11e5556a-a1d9-4a4e-976c-a23b1294c1aen%40googlegroups.com.
Casolyn
Apr 16, 2023, 10:11:16 AM4/16/23
to distance-sampling
Dear Duane,
My transect lines are indeed bound by infrastructure causing a density gradient. This specific dataset was from the city centre. In this area the transect lines are flanked on both sides by tall buildings close to the road with no front gardens. Feral pigoens along the transects were either seen on the road and sidewalks or in the windowsills of the buildings along the transect. This resulted in more counts of pigeons along the 0-5 meter ranges due to the fact that the roads in my sampled city centre are very narrow.
Your suggestion that my transects may be bound by bias due to the nature of feral pigeon foraging behaviour is indeed something i have described in my discussion and am aware off. But i thank you for the quick response.
Your suggestion that my transects may be bound by bias due to the nature of feral pigeon foraging behaviour is indeed something i have described in my discussion and am aware off. But i thank you for the quick response.
But my question remains. What if there is a spike at zero distances and therefore a detection function that fall away to rapidly, how does this affect the estimated density calculation that the model does. I know there is an overestimation of the density but i would like to understand why this happens.
Again thank you.
With kind regards,
Casolyn
Op zondag 16 april 2023 om 15:29:17 UTC+2 schreef duan...@gmail.com:

Eric Rexstad
Apr 16, 2023, 12:19:34 PM4/16/23
to Casolyn, distance-sampling
Casolyn
Picking up from Dr Diefenbach (thanks Duane). Conventional distance sampling assumes the distribution of animals at varying distances from the line transect is uniform. Hence, the shape of the histogram of perpendicular distances is caused by a decline in detection
probability with distance from the transect.
If the uniformity assumption (otherwise known as the "design" assumption, Buckland et al. (2015: 12) is not true (as is likely because of your transects on roads), then the "overabundance" of pigeons at small distances from the transect is interpreted as a
rapid decline in detection probability. In other words, the wrong detection function is being applied to the data. This incorrect detection function falls away too rapidly, resulting in an estimated detection probability being too small; see Buckland et al.
(2015: Fig 1.5 p 11). A detection probability estimate that is biased low results in a density estimate that is biased high.
Hope that helps.
From: distance...@googlegroups.com <distance...@googlegroups.com> on behalf of Casolyn <caso....@gmail.com>
Sent: 16 April 2023 15:11
To: distance-sampling <distance...@googlegroups.com>
Subject: Re: [distance-sampling] Spikes near zero and it effect on the detection function
Sent: 16 April 2023 15:11
To: distance-sampling <distance...@googlegroups.com>
Subject: Re: [distance-sampling] Spikes near zero and it effect on the detection function
To view this discussion on the web visit
https://groups.google.com/d/msgid/distance-sampling/a637f8f8-16bd-4666-93c9-a54569dc5b9en%40googlegroups.com.
Casolyn
Apr 16, 2023, 1:36:40 PM4/16/23
to distance-sampling
Dear Eric,
Thank you for the quick response. With this explanation i now understand the issues i had with my dataset and the outcomes that were provided via the distance sampling in R.
With kind regards,
With kind regards,
Casolyn van der Schoot
Op zondag 16 april 2023 om 18:19:34 UTC+2 schreef Eric Rexstad:
Reply all
Reply to author
Forward
0 new messages